 RonOnCrypto
How to Calculate RSI: Formula, Worked Example and Crypto Use
See all 12 timeframes for BTC, ETH and SOL in the multi-timeframe RSI table.
To calculate RSI, divide the average gain by the average loss of the last 14 closes to get RS, then apply RSI = 100 − 100 ÷ (1 + RS). The Relative Strength Index is a momentum oscillator that runs from 0 to 100. J. Welles Wilder Jr. introduced it in 1978 in his book New Concepts in Technical Trading Systems. RSI above 50 means the average gain is larger than the average loss; the closer RSI gets to 100, the stronger the upward momentum, and the closer to 0, the stronger the downward momentum.
This guide covers Wilder’s formula with a hand-calculated BTC example around 80,000 USDT, why RSI values differ between sites, why I use 72/28 and 60/40 zones instead of 70/30, how to read RSI divergence, how to read RSI across timeframes, and how I pair it with a WMA20 Baseline. The short version: RSI tells you about momentum, not where price will go next, so I never use RSI alone to enter a trade.
| RSI at a glance | Value |
|---|---|
| Created by | J. Welles Wilder Jr., 1978 |
| Range | 0 to 100 |
| Default period | 14 candles |
| Formula | RSI = 100 − 100 ÷ (1 + RS), RS = average gain ÷ average loss |
| Classic zones | 70 overbought, 30 oversold |
| Zones I use | 72/28 strong momentum, 60/40 confirmation |
How to calculate RSI with Wilder’s formula
To calculate RSI with Wilder’s formula, follow 4 steps that turn 15 closing prices into average gain, average loss, RS and finally a 0–100 value. The formula is RSI = 100 − 100 ÷ (1 + RS), where RS = average gain ÷ average loss over 14 periods, smoothed Wilder’s way:
- Take the change in closing price of each candle versus the previous candle.
- Split the changes into gains (up candles) and losses (down candles, as positive numbers).
- First value: average gain = sum of gains over 14 candles ÷ 14; average loss works the same way.
- From candle 15 on: new average = (previous average × 13 + the new candle’s value) ÷ 14.
Worked RSI example with BTC around 80,000 USDT
In this example, 15 rounded BTC closes give an RSI of 66.67, and one more down candle of 600 USDT pulls RSI to 58.30. The prices are rounded for easy math and are not real market data:
| Candle | Close (USDT) | Change | Gain | Loss |
|---|---|---|---|---|
| 0 | 80,000 | |||
| 1–5 | 80,400 → 80,200 → 80,500 → 81,000 → 80,700 | +400, −200, +300, +500, −300 | 1,200 | 500 |
| 6–10 | 80,900 → 80,800 → 81,400 → 81,000 → 81,300 | +200, −100, +600, −400, +300 | 1,100 | 500 |
| 11–14 | 81,500 → 81,000 → 81,400 → 81,500 | +200, −500, +400, +100 | 700 | 500 |
| Total, 14 candles | 3,000 | 1,500 |
- Average gain = 3,000 ÷ 14 = 214.29 USDT.
- Average loss = 1,500 ÷ 14 = 107.14 USDT.
- RS = 214.29 ÷ 107.14 = 2.00.
- RSI = 100 − 100 ÷ (1 + 2) = 66.67.
Candle 15 closes at 80,900 USDT, a drop of 600. With Wilder smoothing:
- New average gain = (214.29 × 13 + 0) ÷ 14 = 198.98.
- New average loss = (107.14 × 13 + 600) ÷ 14 = 142.35.
- RSI = 100 − 100 ÷ (1 + 198.98 ÷ 142.35) = 58.30.
Why RSI values differ between websites
RSI values differ between websites mainly because some use Wilder smoothing and others use a simple average of the last 14 changes. If you recalculate candle 15 with a simple average (drop the first +400, add the −600), RSI comes out at 55.32, almost 3 points below Wilder’s 58.30. Price source and unclosed candles add more differences. The RSI table on RonOnCrypto uses the same Wilder smoothing as TradingView and requests the last 300 candles per timeframe, dropping the one still open. The weight of the starting point shrinks by a factor of 13/14 with every candle, to below one billionth after about 285 candles, so it is practically zero.
What does the RSI indicator measure in crypto?
The RSI indicator measures the ratio between the average gain and the average loss of closing prices and maps it onto a 0–100 scale. RSI does not measure volume or money flow. It only measures how much the close changed from one candle to the next.
In crypto, RSI behaves differently from stocks in three ways:
- The market trades 24/7, so the price series is continuous, with no gaps between sessions.
- Daily candles close on UTC time. The data source behind the site’s RSI table (Binance spot) closes the daily candle at 00:00 UTC, and the daily RSI only locks in after that moment.
- Strong runs last a long time. BTC and ETH can hold RSI above 70 or below 30 for many candles in a row, which is why I widen the extreme zones to 72/28.
What do RSI 70 and 30 mean, and why I use 72/28 and 60/40
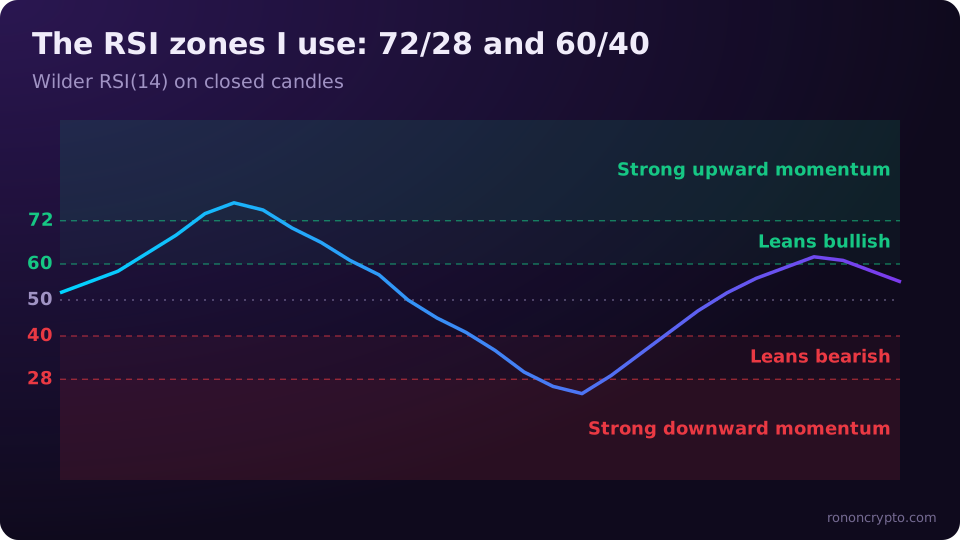
Wilder used 70/30 as overbought and oversold; I use 72/28 as strong-momentum zones and 60/40 as confirmation zones to filter noisy crypto signals. The multi-timeframe RSI table labels each RSI(14) value like this:
| RSI(14) | Label in the table | What it means |
|---|---|---|
| ≥ 72 | Strong upward momentum | Buyers dominate; not a reversal signal |
| 60 – 72 | Leans bullish | Momentum confirms the up side |
| 40 – 60 | Neutral | Two-sided market, signals are noisy |
| 28 – 40 | Leans bearish | Momentum confirms the down side |
| ≤ 28 | Strong downward momentum | Sellers dominate; not a bottom signal |
The key point: in a strong trend, RSI can stay above 70 or below 30 for a long time. Reading “overbought” as “must sell” is the fastest way to short into a rally. That is why I renamed the extreme zones “strong momentum” and use 60/40 to confirm that momentum has clearly picked a side.
What is RSI divergence?
RSI divergence happens when price and RSI move in opposite directions across two consecutive highs or lows, showing that momentum is fading relative to price. There are two common types:
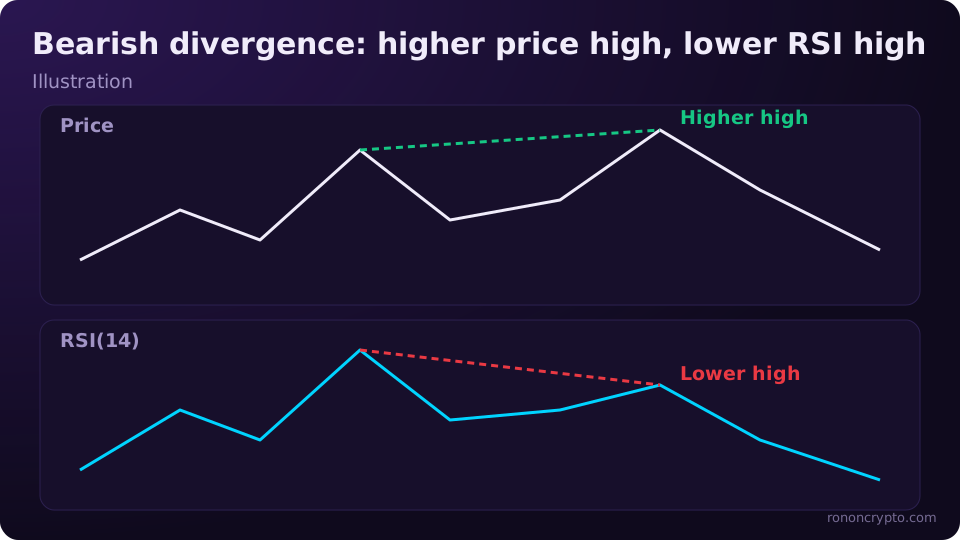
- Bearish divergence: price makes a higher high while RSI makes a lower high. Illustration: BTC tops at 84,000 and then 85,500 USDT, while 4-hour RSI at those two highs reads 78 and 69.
- Bullish divergence: price makes a lower low while RSI makes a higher low. Illustration: lows at 78,000 and then 76,500 USDT, with RSI at 24 and 33.
RSI divergence does not tell you when price will turn. In a strong trend it can appear several times in a row while price keeps going. So I read divergence together with the trend line (the Baseline) and always with a clear stop loss.
How to read RSI across multiple timeframes
Reading RSI across multiple timeframes means comparing RSI on higher timeframes (daily, 4-hour) with lower timeframes (1-hour, 15-minute) to see whether short-term momentum agrees with the bigger picture. The site’s table shows RSI(14) for 12 timeframes, from 5 minutes to 1 month, for BTC, ETH and SOL.
Three typical cases:
| Higher timeframe (1D, 4H) | Lower timeframe (1H, 15m) | What it means |
|---|---|---|
| Leans bullish or strong | Leans bullish | Agreement, momentum is clear |
| Leans bullish | Leans bearish or strong down | Short-term pullback inside a larger uptrend |
| Neutral | Mixed | Choppy market, lower-timeframe signals are noisy |
Example: 15-minute RSI hitting 28 while daily RSI is still above 60 points to a short drop inside a larger trend that leans bullish, not a confirmed reversal.
How to combine RSI with a WMA20 Baseline
The WMA20 Baseline is a weighted moving average of the last 20 closes; I use it as the trend filter and RSI as the momentum gauge. The formula: WMA20 = (1 × C₁ + 2 × C₂ + … + 20 × C₂₀) ÷ 210, where C₂₀ is the latest close and 210 is the sum of the weights 1 to 20. Newer candles carry more weight, so a WMA reacts faster than an SMA.
I tried many indicators and dropped them one by one until only these two were left. Four combinations:
| Price vs Baseline | RSI | How I read it |
|---|---|---|
| Above | ≥ 60 | Trend and momentum both point up |
| Above | ≤ 40 | Price still above trend but momentum is weak, be careful |
| Below | ≤ 40 | Trend and momentum both point down |
| Below | ≥ 60 | Technical bounce under a downtrend, no confirmed reversal |
The Baseline is also a reference for the stop. If the idea behind a trade is “price holds above the Baseline”, the stop goes where that idea is proven wrong. I explain stop placement and sizing in detail in what is a stop loss in crypto.
The same RSI + Baseline pair is the core of my RSI+BL indicator for TradingView, which is coming soon as an invite-only script. It adds a multi-timeframe panel on the chart and automatic alerts by app, email or webhook, and its conditions confirm only on candle close, so it does not repaint.
Common mistakes when using RSI
The most common RSI mistake is treating RSI as a standalone buy or sell signal, when it is only a measure of momentum. The five mistakes I see most:
- Shorting every time RSI is above 70 and longing below 30, which means fighting strong trends.
- Reading RSI on an unclosed candle. RSI on a live candle changes every second, and a “divergence” in the middle of a candle can vanish when it closes.
- Looking at one timeframe only. An oversold 15-minute RSI while the daily chart is in strong downward momentum makes bottom-picking very risky.
- Tweaking the period to fit the past. Making an old chart look good does not make future signals better.
- Entering on RSI without a stop loss. I have traded BTC and ETH perpetual futures since 2020, and in my first year I lost more than I won. The problem was not a missing indicator; it was entering out of fear of missing out, revenge trading and holding losers. RSI only became useful once I applied the rule that no trade may cost more than 1% of the account, with the stop and size set before I click. Whether you go long or short, the position size still comes from the stop.
Use the tool
To see RSI(14) and the WMA20 Baseline for BTC, ETH and SOL across 12 timeframes in one table, open the multi-timeframe RSI table. It is the table I check every day before any analysis: free, calculated on closed candles only, with a count of how many timeframes sit above or below the Baseline. Once you have an idea, use the position size calculator so each trade risks no more than 1% of your account. For funding and open interest context, see the market data dashboard.
Sources: J. Welles Wilder Jr., New Concepts in Technical Trading Systems (1978); Relative strength index, Wikipedia.
This article is for educational purposes only and is not investment advice. Derivatives trading can lose you your entire margin.
FAQ
What is a good RSI number?
There is no good or bad RSI level. RSI only shows which side momentum leans to and how strongly. The same RSI of 75 can mean a healthy uptrend or a move that is about to stall, depending on whether price is above or below its trend line.
Should I keep RSI at 14 or change the period?
14 is the period Wilder proposed and the default on TradingView. A shorter period makes RSI faster and noisier; a longer period makes it slower. The multi-timeframe RSI table on RonOnCrypto uses RSI 14 on every timeframe so the values can be compared.
Why does RSI differ by a few points between websites?
Usually for three reasons: a different price source (spot or futures, and which exchange), a different formula (Wilder smoothing or a simple average), and calculating on a candle that has not closed yet. The RonOnCrypto table uses Wilder's formula, like TradingView, on closed Binance spot candles.
Does RSI work for altcoins?
The formula is identical, but low-liquidity altcoins have more sudden wicks, so RSI reaches extreme zones more often. On small coins I treat RSI readings as less reliable and keep a clear stop loss even more strictly.
Derivatives trading can lose you your entire margin. See the disclaimer.