 RonOnCrypto
Crypto funding rates explained: who pays, how much and how to read them
| Pair | Price | 24h | Funding (8h) | Annualized | Open interest |
|---|---|---|---|---|---|
| BTC | - | - | - | - | - |
| ETH | - | - | - | - | - |
| SOL | - | - | - | - | - |
Source: public exchange APIs (Binance, OKX fallback). Annualized = 8h funding × 3 × 365. Open the full dashboard.
Crypto funding rates are periodic payments that traders holding long and short positions on perpetual futures pay each other, usually every 8 hours, to pull the contract price back toward the spot price. When funding is positive, longs pay shorts; when it is negative, shorts pay longs. Funding is charged on position value, so with high leverage even a small rate like 0.01% turns into a real cost if you hold a trade for several days.
This guide covers why perpetuals need funding, who pays whom, how to calculate the funding fee with a worked example, annualized funding, and how to read funding together with open interest and price. The live funding table on this page lets you check the numbers as you read.
| Attribute | Value |
|---|---|
| Applies to | Perpetual futures only, not spot |
| Typical interval | Every 8 hours (3 times a day); some pairs use 4 hours or 1 hour |
| Positive funding | Longs pay shorts |
| Negative funding | Shorts pay longs |
| Charged on | Position value (size × price), not margin |
| Who pays or receives | Positions still open at the funding timestamp |
Why do perpetual futures need a funding rate?
Perpetual futures need a funding rate because they never expire, so a recurring payment is what stops the contract price from drifting away from the spot price. A traditional futures contract has an expiry date, and on that date its price has to converge with the underlying asset. Perpetual futures remove the expiry, so funding takes over the anchoring job: payments are exchanged periodically between holders of the two sides of the contract to push the contract price toward the asset price, as described in Wikipedia: Perpetual futures (accessed 25 October 2026).
When too many traders go long with leverage, the BTC perpetual trades above spot, funding turns positive and longs have to pay. Holding a long gets more expensive, holding a short earns a payment, and the gap tends to narrow.
Positive vs negative funding rate: who pays whom?
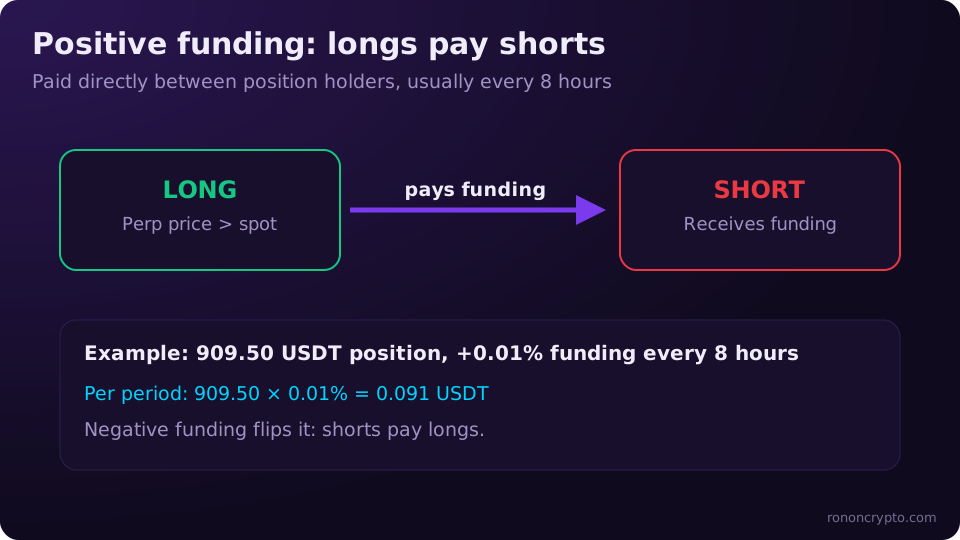
A positive funding rate means longs pay shorts; a negative funding rate means shorts pay longs. The sign of funding shows which side is crowded and willing to pay up on the perpetual contract.
| Funding rate | Contract price vs spot | Who pays | Who receives | Crowd leans |
|---|---|---|---|---|
| Positive (e.g. +0.01%) | Above spot | Longs | Shorts | Long |
| Negative (e.g. −0.01%) | Below spot | Shorts | Longs | Short |
A negative funding rate usually appears when many traders open leveraged shorts. Negative funding does not mean price is about to rise; it only says that holding a short costs money and holding a long earns money right now. If you are not yet sure how the two directions work, read long vs short in crypto.
How to calculate the funding fee: a real cost example
The funding fee for each interval equals position value multiplied by that interval’s funding rate: funding fee = position size × mark price × funding rate. Margin and leverage are not part of the formula, so for the same position value, 5x and 20x pay exactly the same funding.
Example: with a 1,000 USDT account, you open a BTC long at 80,000 USDT with a position value of 909.50 USDT (about 0.0114 BTC). That is the size you get from risking 1% of the account with a stop about 1% from entry, worked through in stop loss in crypto. Funding is +0.01% every 8 hours:
- Per interval: 909.50 × 0.01% = 0.09 USDT (exactly 0.09095).
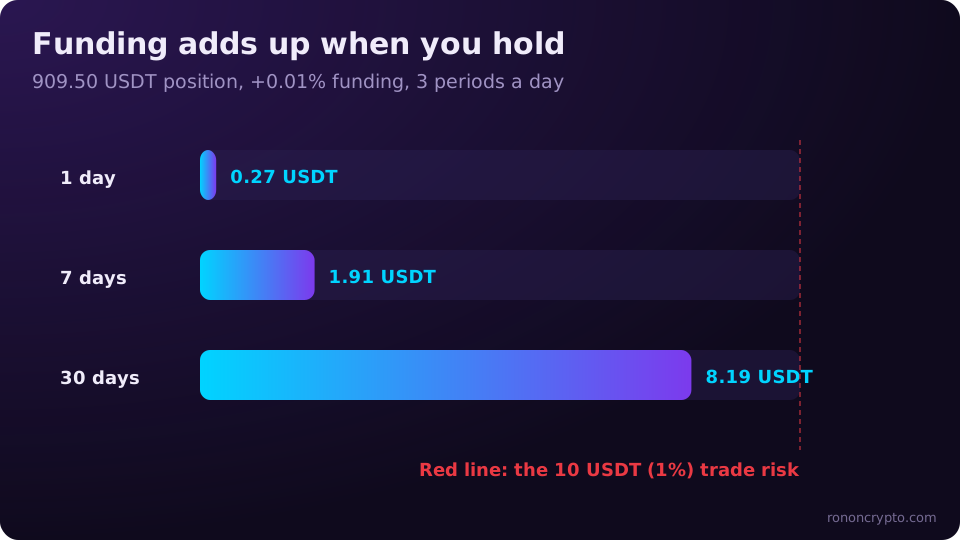
- Per day (3 intervals): 909.50 × 0.01% × 3 = 0.27 USDT.
- Over 30 days: about 8.19 USDT.
0.27 USDT looks tiny until you set it next to your margin. At 10x leverage the margin on this position is only about 90.95 USDT, so 0.27 USDT a day is roughly 0.3% of margin per day, or about 9% of margin after 30 days in the trade.
Funding cost for the same 909.50 USDT position at different rates (8-hour interval, assuming the rate stays constant):
| Funding per 8h | Per interval | Per day | 7 days | 30 days |
|---|---|---|---|---|
| +0.01% | 0.09 USDT | 0.27 USDT | 1.91 USDT | 8.19 USDT |
| +0.03% | 0.27 USDT | 0.82 USDT | 5.73 USDT | 24.56 USDT |
| +0.05% | 0.45 USDT | 1.36 USDT | 9.55 USDT | 40.93 USDT |
| −0.01% (long receives) | +0.09 USDT | +0.27 USDT | +1.91 USDT | +8.19 USDT |
The +0.05% row is the one I want you to remember. I trade by one rule: no trade may cost more than 1% of the account, so a 1,000 USDT account can lose at most 10 USDT on a single trade. Holding a long for 7 days at +0.05% funding costs 9.55 USDT, almost the whole risk budget of the trade, before price ever touches the stop. Funding is a cost to plan for, just like trading fees. You can total both with the trading fee calculator, and maker and taker fees from each exchange’s official fee page sit side by side in futures exchange fees compared.
What is an annualized funding rate?
An annualized funding rate converts one interval’s funding into a yearly rate: funding per interval × intervals per day × 365. For an 8-hour interval, annualized funding = funding × 3 × 365. The RonOnCrypto dashboard calculates its annualized column with exactly this formula.
- +0.01% every 8 hours → 10.95% a year.
- +0.05% every 8 hours → 54.75% a year.
- −0.02% every 8 hours → −21.9% a year.
Annualizing lets you compare funding with a familiar cost of capital, with two caveats. First, funding changes every interval, so the annualized figure is a snapshot of the moment you look, not your cost for the year. Second, a pair on a 4-hour interval must be multiplied by 6 instead of 3: the same 0.01% annualizes to 21.9%. Before comparing two funding numbers, check that they use the same interval.
How to read funding rates with open interest and price
A funding rate only tells you which way the crowd leans; to see whether leverage is building up or unwinding, read funding together with open interest (OI) and price direction. Open interest is the total value of open contracts: rising OI means new positions are opening, falling OI means positions are closing or being liquidated (see what is open interest). The four common cases below help you understand the market; they are not entry signals.
| Price | Open interest | Funding | Common reading | Risk to watch |
|---|---|---|---|---|
| Up | Up | Positive, rising | New leveraged longs, the crowd is chasing price | A reversal can trigger cascading long liquidations |
| Up | Down | Mildly positive or falling | Shorts closing (buying back to exit), little new money | The rally may fade once short covering runs out |
| Down | Up | Negative, falling | New leveraged shorts, the crowd is chasing price lower | A bounce can trigger cascading short liquidations |
| Down | Down | Back near zero | Longs closing or being liquidated, leverage unwinding | Volatility is usually high during the flush, then may calm |
One more case: price moves sideways, OI rises sharply and funding leans hard to one side. Leverage is piling up on the crowded side, and the market tends to move violently when that side gets squeezed. This case does not tell you which way price will break; it is a reminder that your liquidation price must sit well beyond your stop. Check that distance with the liquidation price calculator.
Common mistakes when reading funding rates
The most common mistake is treating the funding rate as a buy or sell signal, when it is only a holding cost and a gauge of crowd positioning. Four mistakes come up again and again:
- Fading funding mechanically. High positive funding can last for days in a strong uptrend. Opening a short just because “funding is too high”, without a stop, is a bet on timing, not on data.
- Calculating funding on margin. Funding is charged on position value. 90.95 USDT of margin at 10x still pays funding on a 909.50 USDT position.
- Comparing different intervals. 0.01% every 4 hours costs twice as much as 0.01% every 8 hours. Always check the interval first.
- Reading funding on its own. Without OI and price direction, positive funding only says “longs are crowded”, not whether that is new money coming in or shorts leaving.
In my first year of trading I lost more than I won, because I entered out of fear of missing out and held losers because I would not admit I was wrong. Funding did not cause those mistakes, but a losing trade held too long also gets chipped away by funding every 8 hours.
Use the tool: check live funding and cost a trade before you enter
The crypto funding rates table on this page pulls live data from public market data APIs. To see funding, annualized funding, open interest, price and the Fear & Greed Index for BTC, ETH, SOL, BNB and XRP on one screen, open the crypto market data dashboard. After reading funding, size the trade at 1% risk with the position size calculator, then add the expected funding for the number of days you plan to hold.
Educational content only, not investment advice. Derivatives trading uses leverage, and you can lose your entire margin.
FAQ
Is the funding rate a fee the exchange charges?
No. Funding is money that moves between traders holding longs and traders holding shorts; the exchange only calculates and transfers it. The trading fee (maker or taker fee) is what the exchange earns, and it is a separate cost.
Do I pay funding if I close my position before the funding time?
Usually not. Funding applies only to positions that are still open at the funding timestamp; close before it and you neither pay nor receive. Exact rules can differ between exchanges, so check the contract specification where you trade.
Do spot trading or dated futures have a funding rate?
No. Funding rates exist only on perpetual futures. Spot has no contract leverage, so it does not need one, and dated futures converge to the spot price on their own at expiry.
Can the funding rate change while I am holding a position?
Yes. The rate is recalculated every interval from the gap between the contract price and the spot price, so a trade held for several days can pay a low rate today and a much higher one next week.
Derivatives trading can lose you your entire margin. See the disclaimer.