 RonOnCrypto
What is open interest? How to read OI with price and funding
| Pair | Price | 24h | Funding (8h) | Annualized | Open interest |
|---|---|---|---|---|---|
| BTC | - | - | - | - | - |
| ETH | - | - | - | - | - |
| SOL | - | - | - | - | - |
Source: public exchange APIs (Binance, OKX fallback). Annualized = 8h funding × 3 × 365. Open the full dashboard.
Open interest (OI) is the total number of derivative contracts that are currently open, meaning they have been opened but not yet closed or settled. On a BTC perpetual, OI tells you how many BTC (or how many USDT) sit in leveraged positions at a given moment. This guide covers what OI is, how it differs from volume, what rising and falling OI mean, 4 OI and price scenarios, OI and liquidation cascades, reading OI with the funding rate, and the limits of the metric. The short answer: OI measures how much leverage is open, not which way price will move, so it is only useful when read with price and funding.
| Attribute | Value |
|---|---|
| Also called | Open interest, OI, open contracts |
| Measures | Total size of derivative contracts not yet closed |
| Unit | Coins (e.g. 10,000 BTC) or USD/USDT value |
| Exists in | Dated futures, perpetual futures, options; not spot |
| Does not tell you | Whether longs or shorts are more numerous, or where price will go |
What is open interest?
Open interest is the total number of derivative contracts that have not been settled, matching Wikipedia’s definition: “the total number of outstanding derivative contracts that have not been settled” (Wikipedia: Open interest, accessed 25 October 2026). Every contract has two sides: one trader opens a long and another opens a short of the same size. OI counts that pair only once.
Example: you open a 1 BTC long on the BTC/USDT perpetual, and another trader opens a 1 BTC short that matches yours. OI rises by 1 BTC (80,000 USDT at a price of 80,000), not by 2 BTC.
Open interest vs volume: what is the difference?
Volume counts the total amount traded over a period, while open interest counts the size of positions still open at one moment. Volume always adds up trade by trade; OI can stay flat or fall even when volume is huge.
| Volume | Open interest | |
|---|---|---|
| Measures | Amount matched in trades | Positions not yet closed |
| Time frame | A period (24 hours, one candle) | A single moment |
| Effect of closing a trade | Still adds to volume | Can reduce OI |
| Answers | How active is the market? | How much leverage is on the table? |
Here are 4 simulated trades on the BTC/USDT perpetual at 80,000 USDT, to show how the two numbers separate:
| Step | Trade | Volume added | OI after trade |
|---|---|---|---|
| 1 | Alice opens a 1 BTC long, Bob opens a 1 BTC short | 1 BTC | 1 BTC |
| 2 | Carol opens a 0.5 BTC long, Alice closes 0.5 BTC of her long | 0.5 BTC | 1 BTC (changed hands, unchanged) |
| 3 | Bob closes 0.5 BTC of his short, Carol closes her 0.5 BTC long | 0.5 BTC | 0.5 BTC |
| 4 | Dave opens a 2 BTC short, Eve opens a 2 BTC long | 2 BTC | 2.5 BTC |
After 4 steps, volume is 4 BTC (320,000 USDT) while OI is 2.5 BTC (200,000 USDT).
What do rising and falling open interest mean?
Open interest rises when both sides of a trade open new positions, falls when both sides close positions, and stays flat when one side opens while the other closes. These three rules apply to every derivative contract:
- New + new: OI rises; more leverage enters the market.
- New + closing: OI is unchanged; the position just moves from one trader to another.
- Closing + closing: OI falls; leverage leaves the market (including voluntary closes, stop losses and liquidations).
OI in USD moves with price
Open interest measured in USD changes with price even when no new positions open. Say BTC open interest is 10,000 BTC at 80,000 USDT, or 800 million USDT. If price rises to 84,000 USDT (+5%) and nobody opens anything new, OI in USD becomes 840 million USDT, also +5%. That is why you compare the change in OI with the change in price: OI up 12% while price is up 5% is what shows new positions. The RonOnCrypto dashboard shows OI as USD value, so this comparison matters when you read the number.
4 open interest and price scenarios
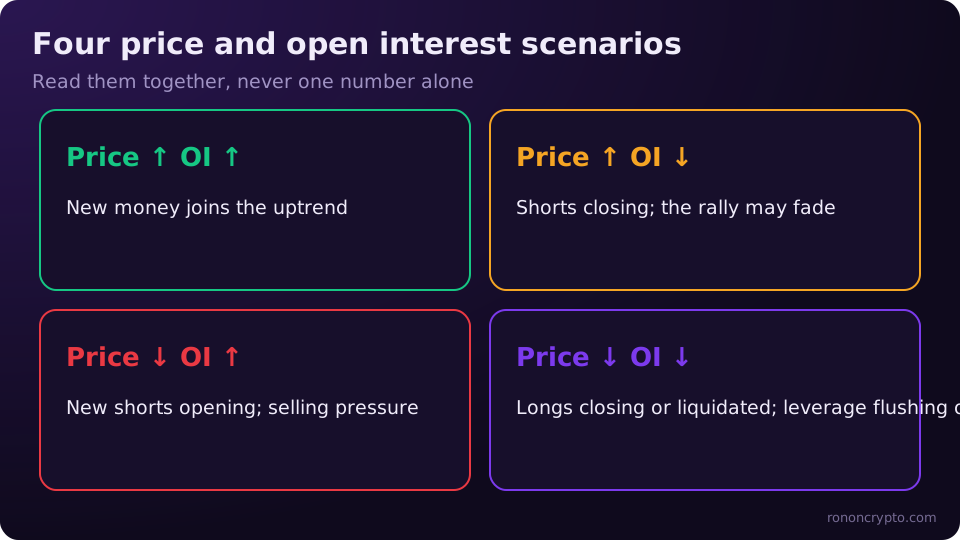
There are 4 basic combinations of price direction and open interest direction, and each one points to a different kind of money flow. These are common readings, not entry signals; the same combination can have more than one cause.
| Price | OI | Common reading | What to watch |
|---|---|---|---|
| Up | Up | New positions opening with the trend, fresh money joining | Leverage is building; if funding is high and positive, longs are crowded |
| Up | Down | Shorts closing or being liquidated (short covering), longs taking profit | The rally has few new positions behind it |
| Down | Up | Heavy new shorts, or longs buying the dip with leverage | Selling pressure carries extra leverage; one side will have to close later |
| Down | Down | Longs cutting losses or being liquidated, leverage flushing out | Leveraged selling pressure fades as OI drops further |
Open interest rising while price moves sideways
Open interest rising sharply while price moves sideways shows leverage building on both sides, and the market is prone to a sharp move when price breaks out of the range. The more leveraged positions open inside a narrow range, the more stop losses and liquidation prices sit just above and below it. OI does not tell you whether price will break up or down, only that many positions will be forced to close once it moves.
Open interest and liquidation cascades
A liquidation cascade happens when price hits the liquidation level of one group of positions, the forced orders push price further, and price then hits the liquidation level of the next group. High open interest makes this chain longer, because there are more leveraged positions to get pulled in.
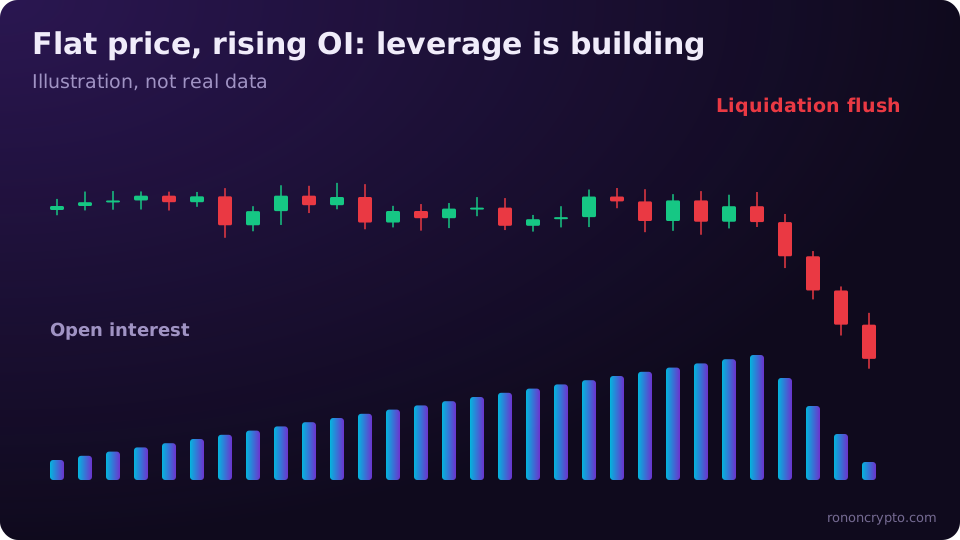
Example: a 10x BTC long with isolated margin, entry at 80,000 USDT and 0.5% maintenance margin. The liquidation price is roughly 80,000 × (1 − 1/10 + 0.005) = 72,400 USDT, so a drop of only about 9.5% is enough. A 20x position liquidates around 76,400 USDT, just about 4.5% from entry. When price reaches the 76,000 area, the 20x positions are closed with market sells, dragging price toward the 10x positions. After a chain like this, OI usually drops sharply within a short time.
The real formula on each exchange adds fees and margin tiers, so check your own numbers with the liquidation price calculator. My rule is that no trade may cost more than 1% of the account, with the stop and the size set before I click, so my stop always sits far from the liquidation price. How I place stops is covered in stop loss in crypto.
How to read open interest with the funding rate
The funding rate shows whether the crowd leans long or short, and open interest shows how much leverage stands behind that lean; reading both together is clearer than reading either alone. Positive funding means longs pay shorts, and exchanges usually charge it every 8 hours.
- OI rising + high positive funding: many new leveraged longs; the long side is crowded and paying to hold. If price falls, this group gets liquidated first.
- OI rising + negative funding: shorts are piling up and paying longs. A fast rally can force shorts to close en masse.
- OI falling + funding back near zero: leverage is leaving the market and the imbalance between the two sides is shrinking.
The funding cost of a position, annualized funding and the four-case table for reading funding with OI and price are in crypto funding rates explained.
Limits of open interest
Open interest has 4 main limits: it has no direction, it differs between sources, it is pulled by price when measured in USD, and it is only a snapshot of one moment.
- No direction. Every contract has one long and one short, so rising OI does not mean “longs are stronger”.
- Different sources, different numbers. OI from one exchange differs from OI combined across several. The RonOnCrypto dashboard takes OI from one large exchange’s public API (the source is shown under the table), not the whole-market total.
- Price effect. OI in USD rises 5% when BTC rises 5%, even with no new positions.
- One moment. A single OI number on its own says nothing. Compare it with itself at an earlier time: note the number at two points, or look at an OI chart over time on a derivatives charting site.
Because of these limits, I treat open interest as a measure of how crowded leverage is, not as an entry indicator. Direction and momentum I read with RSI and the Baseline (WMA20) on the multi-timeframe RSI table.
Use the tool: check live open interest on the dashboard
The live OI table on this page and the crypto market data dashboard show open interest (USD value), price, 24-hour change and the funding rate (the table on this page covers BTC, ETH and SOL; the dashboard adds BNB and XRP), pulled from public APIs on every page load. Now that you know what open interest is, a simple routine: note BTC open interest at two points in time, compare the change in OI with the change in price, then look at funding to see which side is crowded. Before any trade, size it at 1% risk with the position size calculator and check the liquidation price with the liquidation price calculator.
Educational content only, not investment advice. Derivatives trading uses leverage, and you can lose your entire margin.
FAQ
Does open interest include spot trading?
No. Open interest exists only in derivatives markets such as dated futures, perpetual futures and options. A spot trade exchanges the asset immediately and leaves no open contract behind.
Does OI tell me whether there are more longs or more shorts?
No. Every open contract has one long and one short of the same size. To see which way the crowd leans, also check the funding rate or the long/short account ratio an exchange publishes.
Why does every data site show a different open interest number?
Sites differ in four ways: one exchange or several combined, OI in coins or in USD, USDT-margined and coin-margined contracts combined or separate, and update time. OI comparisons are only valid with the same source and the same unit.
Does record-high OI mean price is about to reverse?
Not necessarily. Record-high OI only says that more leverage is open than at any earlier point, so a sharp move is more likely, but it says nothing about direction. Price can keep trending while OI keeps rising.
Derivatives trading can lose you your entire margin. See the disclaimer.