 RonOnCrypto
Trading Journal Template: How to Keep a Crypto Trading Journal and Track Results in R
On this page · 8
- What is a trading journal for?
- What columns should a trading journal template have?
- What should you record before entering and after closing a trade?
- How do you calculate trade results in R in a trading journal?
- Example: 10 sample trades in a trading journal (simulated data)
- Weekly trading journal review: win rate and expectancy in R
- How does a trading journal help you see greed and fear?
- Use the position size calculator to fill in your trading journal
Need leverage, liquidation price and take-profit targets? Open the full calculator.
A trading journal is a log of every trade you take, recording the plan before entry (entry, stop loss, take profit, position size), the result after the close and your emotion when you clicked, so you can measure win rate and expectancy from your own data. For BTC and ETH futures, the most useful habit is recording results in R: net P&L after fees divided by the amount you chose to risk. That puts a 909.50 USDT trade and a 1,663.89 USDT trade on the same scale.
This guide covers, in order: what a trading journal is for, which columns a trading journal template needs (with a CSV download), what to record before and after each trade, how to calculate results in R, an example of 10 sample trades, a weekly review of win rate and expectancy, and how a journal makes greed and fear visible. The short version: write the plan down before you enter, record the result in R, and review the trades with mistakes separately every week.
Note: the 10 trades in this guide are simulated sample data that illustrate how to log and calculate, not real trades and not trade signals.
| Key fact | Value in this guide’s example |
|---|---|
| Columns in the journal template | 15 columns, downloadable CSV |
| 1R (risk per trade) | 10 USDT, 1% of a 1,000 USDT account, including a 0.05% fee per side |
| Result formula | Result (R) = Net P&L after fees ÷ 1R |
| 10 simulated sample trades | 5 wins, 5 losses, 50% win rate, +2.37R in total |
| Expectancy per trade | +0.24R |
| Trades that followed the plan / with a mistake | 6 trades +5.91R / 4 trades −3.54R |
What is a trading journal for?
A trading journal replaces the feeling of “trading well lately” with three measured numbers: win rate, average result in R and expectancy per trade. Without them, ideas like the risk reward ratio and break-even win rate stay theoretical, because you do not know your real win rate.
A journal answers three questions that memory usually gets wrong:
- Was risk kept at 1%? Any trade that lost more than −1R broke the plan, most often because the stop was moved.
- Does this setup have positive expectancy? Expectancy comes from the R results of many trades, not from one big winner.
- Which mistakes repeat? The emotion and mistake columns show whether a loss came from the market or from you.
Risk reward and break-even win rates are covered in the guide to the risk reward ratio; the journal is where you get the real win rate to plug into that math.
What columns should a trading journal template have?
A futures trading journal template needs 15 columns in three groups: the plan (filled before entry), the result (filled after the close) and psychology (filled right after the close, while you still remember). The table lists each column in the same order as the trading journal template CSV, with the values of sample trade 1:
| Column | What to record | Trade 1 example |
|---|---|---|
| Date | Entry date (YYYY-MM-DD) | 2026-10-19 |
| Pair | Contract traded | BTCUSDT |
| Side | Long or Short | Long |
| Entry | Fill price at entry | 80000 |
| Stop loss | Stop price set at entry | 79200 |
| Take profit | Planned target price | 81600 |
| Size (USDT) | Position value | 909.50 |
| Risk 1R (USDT) | Loss if the stop is hit, fees included | 10 |
| Exit | Actual exit price | 81600 |
| Fees (USDT) | Entry fee + exit fee | 0.92 |
| Net P&L (USDT) | P&L after fees | 17.27 |
| Result (R) | Net P&L ÷ 1R | 1.73 |
| Reason | The setup, in one sentence | Pullback to support, 4h RSI back above 50 |
| Emotion | How you felt when you clicked | Calm |
| Mistake | Deviation from the plan, or “None” | None |
The file uses a dot as the decimal separator and commas between columns, so Google Sheets and English-locale Excel open it directly; in other locales, use Data > From Text/CSV. The Reason column only needs one sentence, but write it before you click; written after the close, the reason tends to get edited to fit the result.
What should you record before entering and after closing a trade?
To make a trading journal useful, fill the 9 plan and reason columns before you click, then fill the 6 result and psychology columns right after the close. The order matters because it locks the plan in before emotions get a say.
- Before entry: record date, pair, side, entry, stop loss, take profit and reason. Enter the entry, stop and account size in the position size calculator at 1% risk, then copy the position size and the risk amount (1R) into their columns.
- At the close: record the actual exit price, fees and net P&L. Take P&L and fees from the platform’s trade history, or recalculate them with the PnL and ROE calculator.
- Right after: record your emotion at entry and the mistake, if any. Use the words you actually had in your head: “afraid to miss it”, “angry”, “afraid to give back profit” are more useful than “bad”.
The stop loss column is the price set at entry and is never edited when the stop moves. If you move the stop, the exit column will show a loss bigger than 1R by itself, and that is exactly the data you need to see. How to place the stop from price structure is in the stop loss guide.
How do you calculate trade results in R in a trading journal?
A result in R is a trade’s net P&L after fees divided by the amount you planned to lose on it (1R): a trade stopped out as planned is −1R, and a trade that makes twice its risk is about +2R. Recording in R puts every trade on one scale, whatever the pair, price or position size.
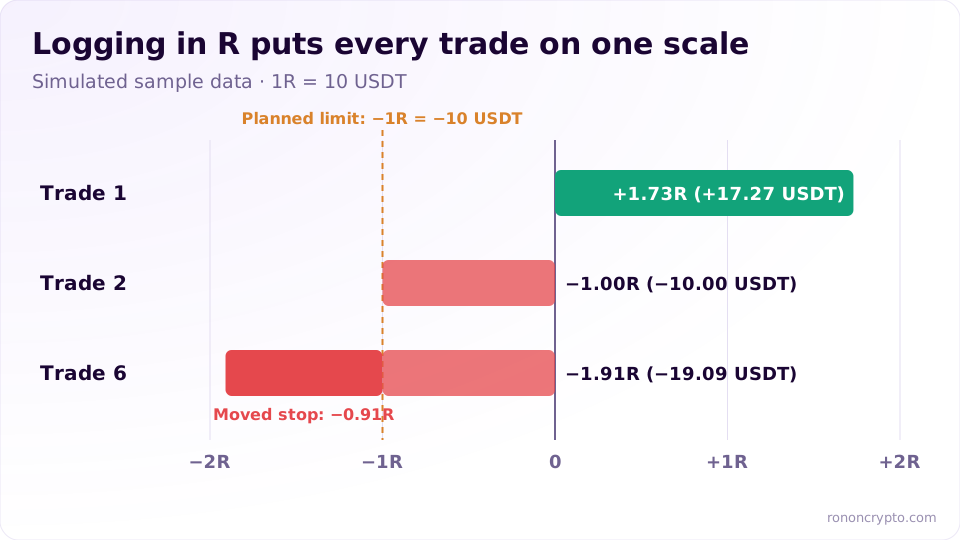
In the sample trades, 1R is always 10 USDT (1% of a 1,000 USDT account), because position size is calculated so that hitting the stop costs exactly 10 USDT including the 0.05% fee per side:
- Trade 1, BTC long at 80,000, closed at 81,600: gross profit 18.19 USDT, fees 0.92 USDT, net profit 17.27 USDT, result +1.73R.
- Trade 2, ETH short at 3,000, stopped at 3,045: position size 624.71 USDT, net loss 10.00 USDT, result −1.00R.
- Trade 6, BTC short at 81,000, stop at 81,810 moved out to 82,620: net loss 19.09 USDT, result −1.91R, almost double the planned loss.
Trade 1 made +1.73R rather than +2R even though the target was set at 1:2, because fees take part of the profit and 1R already includes fees. In a spreadsheet, the Result (R) column is =K2/H2 and the Net P&L column is =IF(C2="Long",1,-1)*G2*(I2-D2)/D2-J2. Fees are charged on position value; base-tier fees on major platforms are listed on the futures exchange fees page.
Example: 10 sample trades in a trading journal (simulated data)
The table is one week of a trading journal with 10 simulated sample trades, risking 10 USDT per trade on a 1,000 USDT starting balance, with a 0.05% fee per side. Prices, dates, reasons and emotions were built to illustrate how to log, not real trades and not trade signals.
| # | Date | Pair | Side | Entry | Stop | Exit | Result (R) | Emotion | Mistake |
|---|---|---|---|---|---|---|---|---|---|
| 1 | Oct 19 | BTC | Long | 80,000 | 79,200 | 81,600 | +1.73 | Calm | None |
| 2 | Oct 19 | ETH | Short | 3,000 | 3,045 | 3,045 | −1.00 | Calm | None |
| 3 | Oct 20 | BTC | Long | 80,400 | 79,600 | 79,600 | −1.00 | Fear of missing out (FOMO) | Entry outside the plan |
| 4 | Oct 20 | BTC | Long | 79,800 | 79,400 | 79,400 | −1.00 | Angry, wanted it back | Revenge trade right after a loss |
| 5 | Oct 21 | ETH | Long | 2,950 | 2,920.5 | 2,965 | +0.37 | Afraid to give back profit | Closed early before target |
| 6 | Oct 21 | BTC | Short | 81,000 | 81,810 | 82,620 | −1.91 | Stubborn, would not admit wrong | Moved the stop further away |
| 7 | Oct 22 | BTC | Long | 79,000 | 78,210 | 81,370 | +2.64 | Calm | None |
| 8 | Oct 22 | ETH | Short | 3,020 | 3,065.3 | 2,929.4 | +1.81 | Calm | None |
| 9 | Oct 23 | BTC | Long | 80,500 | 79,695 | 79,695 | −1.00 | Calm | None |
| 10 | Oct 23 | ETH | Long | 2,980 | 2,950.2 | 3,039.6 | +1.73 | Calm | None |
All 15 columns for the 10 trades (take profit, size, fees, net P&L, reason) are in the CSV template. Trade 4 has a 1,663.89 USDT position because its stop is only 0.5% away, yet it still loses just 10 USDT; a bigger position does not mean bigger risk when it is sized from the stop.
Weekly trading journal review: win rate and expectancy in R
A weekly review means calculating 6 numbers from the Result (R) column: win rate, average winning R, average losing R, expectancy per trade, longest losing streak and the number of trades that lost more than 1R. Expectancy is the average result per trade if you repeat the same way of trading, the expected value concept from probability, according to Wikipedia, Expected value (accessed 25 October 2026).
Formula: Expectancy (R) = Win rate × Average win in R − Loss rate × Average loss in R. For the 10 sample trades:
| Weekly metric | Value (10 simulated sample trades) |
|---|---|
| Win rate | 50% (5/10) |
| Average winning trade | +1.66R |
| Average losing trade | −1.18R |
| Expectancy per trade | 0.5 × 1.66 − 0.5 × 1.18 = +0.24R |
| Week total | +2.37R, or +23.65 USDT after 9.31 USDT in fees |
| Longest losing streak | 3 trades (trades 2, 3 and 4) |
| Trades that lost more than 1R | 1 trade (trade 6, −1.91R) |
The number worth reading twice is the average loss of −1.18R instead of −1.00R: one moved stop is enough to drag the whole group of losers down. With an average win of 1.66R and an average loss of 1.18R as in this week, the break-even win rate is average loss ÷ (average win + average loss) = 1.182 ÷ (1.656 + 1.182) ≈ 41.65% (calculated on the unrounded averages). Positive expectancy over 10 simulated trades proves nothing about next week; it only shows how to read the journal.
How does a trading journal help you see greed and fear?
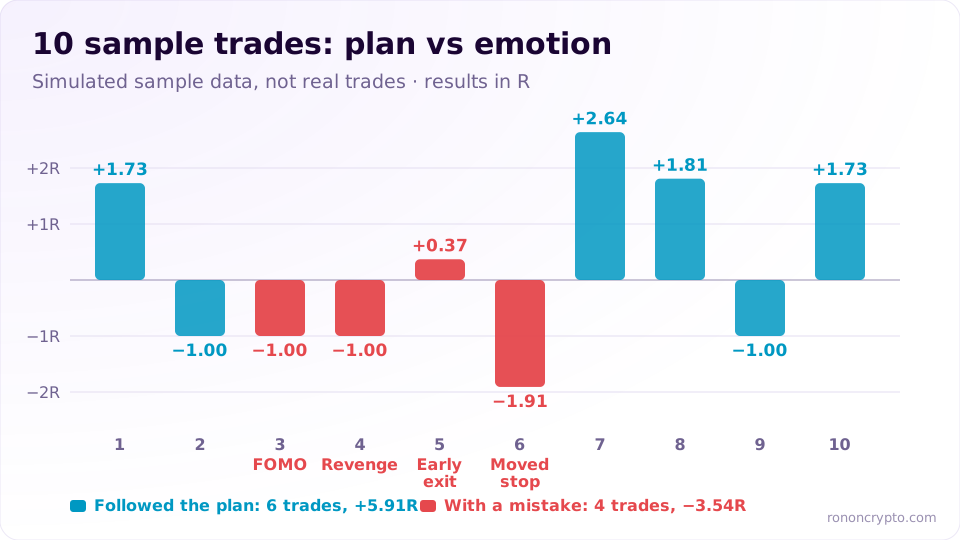
A trading journal turns greed, fear and stubbornness into numbers, because the emotion and mistake columns let you separate trades that followed the plan from trades driven by emotion, then add up the R of each group. In the 10 simulated sample trades, the two groups point in opposite directions:
| Trade group | Trades | Total R | Expectancy per trade |
|---|---|---|---|
| Followed the plan (Mistake = None) | 6 | +5.91R | +0.99R |
| Emotional mistake | 4 | −3.54R | −0.89R |
The four mistakes match four familiar reactions: fear of missing out (trade 3), anger and the urge to win it back (trade 4), fear of giving back profit and closing early (trade 5), and stubbornly refusing to be wrong by moving the stop (trade 6). These are also the habits described on the about page: entering out of fear of missing out, revenge trading after losses and holding losers out of an unwillingness to admit being wrong; greedy, wanting a bigger position; scared, cutting too early; stubborn, refusing to stop. A spreadsheet does not make emotions go away. It shows you how many R each one costs.
Every week, filter the Mistake column for anything other than “None” and read those rows before you look at total P&L. A journal is part of crypto risk management: the 1% rule caps the damage of each trade, and the journal tells you whether the rule was actually kept.
Use the position size calculator to fill in your trading journal
The position size calculator at 1% risk gives you the two hardest journal columns before you click: position size and the amount at risk (1R). Enter account size, risk %, entry, stop loss, leverage and fees, and it returns position size, margin, the estimated liquidation price and a table of take-profit targets by risk reward. Copy the size and 1R into the trading journal template, and after the close the Result (R) column shows how far the trade landed from the plan.
This content is for educational purposes only and is not investment advice. Trading derivatives carries the risk of losing your entire margin.
FAQ
Should you keep a trading journal in Excel, Google Sheets or a dedicated app?
A spreadsheet is enough for most traders starting out, because you see the R and expectancy formulas yourself instead of getting a ready-made number. The template in this guide is a 15-column CSV that opens in Excel, Google Sheets or LibreOffice. A dedicated app helps once you log many trades, but you still have to type the emotion and mistake columns yourself.
How many trades do you need before a journal tells you anything?
There is no fixed number. Ten trades, as in this guide's example, are enough to spot a repeated mistake but not enough to conclude that a setup has positive expectancy. The more trades you log with the same setup and the same risk, the more reliable the measured win rate and expectancy become.
How do you log a trade with partial take profits?
Use one row for the whole trade: the exit price is the size-weighted average of the parts you closed, and the R result is the total net P&L of all parts divided by the original 1R. Do not recalculate 1R from a new stop after moving it, or the R result will look better than it really was.
Should you journal demo trades too?
Yes, on a separate sheet or with a demo note, because R results from demo trades still show whether you followed the plan. Emotions on a demo account are usually milder than with real money, so do not mix the two when you calculate expectancy.
Derivatives trading can lose you your entire margin. See the disclaimer.