 RonOnCrypto
Crypto Risk Management for Futures: A 7-Step Process Before Every Trade
On this page · 11
- What does crypto risk management include?
- What is drawdown, and why are deep losses so hard to recover?
- How much should you risk per trade in crypto?
- What are the steps of risk management before every trade?
- How do you calculate position size at 1% risk?
- Where do leverage, margin and liquidation fit in risk management?
- What are total open risk and daily or weekly loss limits?
- What do risk reward and expectancy tell you about risk management?
- How does a trading journal support risk management?
- What are the most common risk management mistakes?
- Use the position size calculator before every trade
- Balance left
- -
- Drawdown
- -
- Gain needed to get back
- -
- Losses in a row to lose 20% / 50%
- -
Crypto risk management is the set of rules that decides how much each trade may lose, how big the position is, how you use leverage and margin, and when you stop trading, so a losing streak cannot wipe out the account. With the 1% rule, a 1,000 USDT account loses only 10 USDT each time a stop is hit; a BTC long at 80,000 with a stop at 79,200 therefore has a position size of 909.50 USDT, whether leverage is 5x or 50x.
This is the hub page for the risk management cluster on RonOnCrypto, and it goes in this order: what risk management is made of, what drawdown is and why deep losses are hard to recover, how much to risk per trade, a 7-step process before every trade, how to size a position, where leverage, margin and liquidation fit, total open risk and daily or weekly loss limits, risk reward and expectancy, the trading journal, and the most common mistakes. Each part has its own detailed guide. The short version: choose the loss you can accept first, let position size carry the risk, and judge results with numbers rather than feelings.
| Key fact | Value in this guide’s example |
|---|---|
| Account and risk per trade | 1,000 USDT, 1% = 10 USDT |
| Example trade | BTC long at 80,000, stop at 79,200 (1% away), 0.05% fee per side |
| Position size at 1% risk | 909.50 USDT, about 0.0114 BTC |
| Margin and liquidation at 10x (isolated, 0.5% maintenance margin) | 90.95 USDT, estimated liquidation at 72,400 |
| Consecutive losses to fall more than 20% | 23 at 1% risk, 5 at 5% risk |
| Gain needed to recover from a 50% drawdown | 100% |
What does crypto risk management include?
Crypto risk management has 6 parts: risk per trade, the stop loss, position size, leverage and margin mode, total risk limits (open, daily and weekly) and a journal of results. Each part answers one question that needs an answer before you click. The table is the map of the whole cluster:
| Part | Question to answer | Detailed guide | Tool |
|---|---|---|---|
| Risk per trade | If this trade is wrong, what % of the account is lost? | Stop loss and the 1% rule | Position size calculator |
| Stop loss | Which price shows the reason for the trade is wrong? | Stop loss guide · RSI indicator | Multi-timeframe RSI table |
| Position size and risk reward | How big, where to take profit, what win rate is needed? | Risk reward ratio · Long vs short | Position size calculator |
| Leverage and margin | How much margin is locked, where is liquidation? | Crypto leverage · Liquidation price · Isolated vs cross margin | Liquidation price calculator |
| Costs and total limits | Do fees, funding and total open risk fit the budget? | Funding rate · Perpetual futures | Trading fee calculator |
| Measuring results | What is the real P&L in USDT and in R? | PnL and ROE · Trading journal | PnL and ROE calculator |
Risk management does not pick the direction of a trade and does not predict price. It only decides the cost of being wrong, and keeps that cost small enough that you still have capital to keep trading.
What is drawdown, and why are deep losses so hard to recover?
Drawdown is the fall in your account from its most recent peak, and because the recovery gain is earned on a smaller balance, the deeper the drawdown, the much larger the gain needed to get back to the peak. According to Wikipedia, Drawdown (economics) (accessed 25 October 2026), drawdown measures the decline from a historical peak, and maximum drawdown is the largest such decline over the whole history.
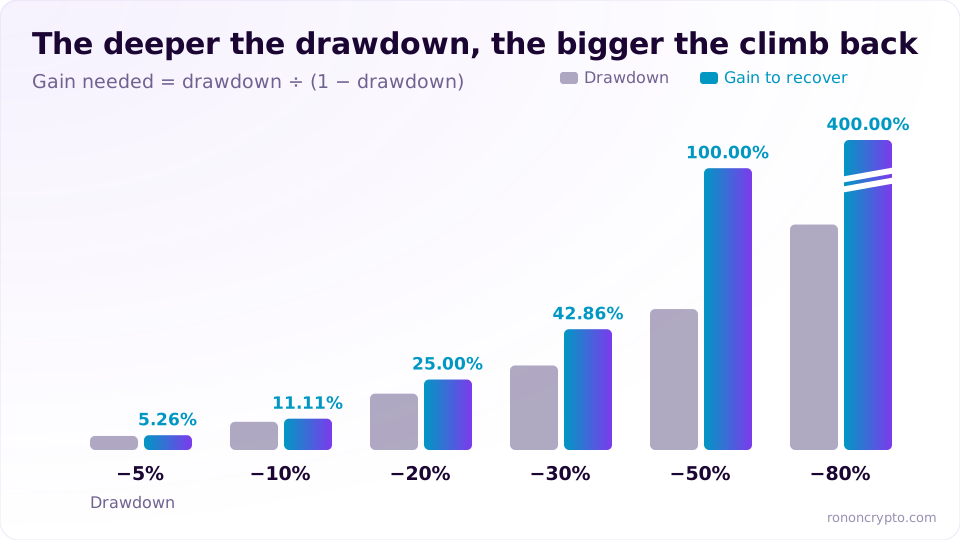
Formula: Gain needed to recover = Drawdown ÷ (1 − Drawdown). With a 1,000 USDT peak:
| Drawdown | Balance left | Gain needed to return to 1,000 USDT |
|---|---|---|
| 5% | 950 USDT | 5.26% |
| 10% | 900 USDT | 11.11% |
| 20% | 800 USDT | 25.00% |
| 30% | 700 USDT | 42.86% |
| 50% | 500 USDT | 100.00% |
| 80% | 200 USDT | 400.00% |
A 10% drawdown needs an 11.11% gain to recover, but a 50% drawdown needs the remaining balance to double. This is why risk management puts small drawdowns ahead of big winners: a deep loss takes more time and more correct trades to repair. At the extreme, the chance of losing so much capital that you cannot keep trading is called risk of ruin, according to Wikipedia, Risk of ruin (accessed 25 October 2026).
How much should you risk per trade in crypto?
A sensible risk per trade is one where a long losing streak, which every trader meets, still takes only a small part of the account; at 1% risk per trade, it takes 23 losses in a row to fall more than 20%. There is no single right number for everyone. RonOnCrypto uses 1% per trade; the story behind that rule, a first year with more losses than wins, is on the about page.
The table counts how many consecutive losses it takes to reach each level, with risk taken as a percentage of the current balance:
| Risk per trade | Losses in a row to fall 10% or more | 20% or more | 50% or more |
|---|---|---|---|
| 0.5% | 22 | 45 | 139 |
| 1% | 11 | 23 | 69 |
| 2% | 6 | 12 | 35 |
| 5% | 3 | 5 | 14 |
| 10% | 1 | 3 | 7 |
The balance left after 5 and 10 losses at each risk level is in the stop loss guide, in the section on the 1 percent rule.
Long losing streaks happen more often than you think
A long losing streak is a normal result of probability, not a sign that your system is broken. The calculation assumes 100 independent trades, each one either a win or a loss:
| Win rate | At least one streak of ≥5 losses | ≥6 losses | ≥8 losses | ≥10 losses |
|---|---|---|---|---|
| 40% | 97.58% | 87.26% | 48.97% | 20.49% |
| 50% | 81.01% | 54.61% | 17.02% | 4.41% |
At a 40% win rate, the chance of at least one streak of 8 losses in 100 trades is about 49%. At 1% risk, 8 losses in a row cost about 7.73% of the account; at 5% risk, the drawdown is about 33.66% and needs a gain of about 50.73% to recover.
What are the steps of risk management before every trade?
Risk management before every trade has 7 steps: set the stop loss, choose the risk percentage, size the position, set the take profit and check risk reward, choose leverage and margin mode, check total risk against daily and weekly limits, and log the trade in your journal. The table walks through the 7 steps with the example BTC long at 80,000 on a 1,000 USDT account:
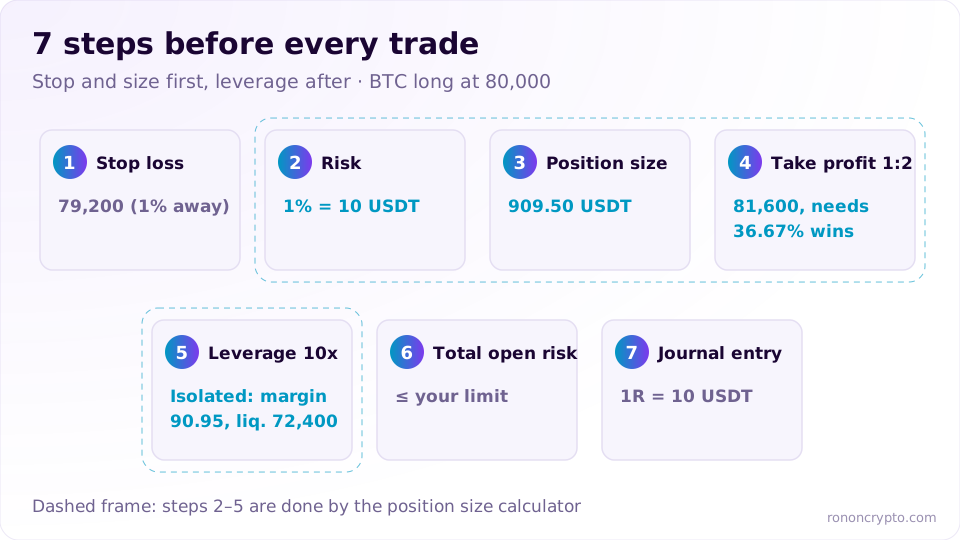
| Step | What to do | Number in the example | Read more / tool |
|---|---|---|---|
| 1 | Place the stop from price structure, where the reason for the trade is no longer valid | Recent low at 79,200, 1% below entry | Stop loss guide |
| 2 | Choose the risk % of the current balance | 1% = 10 USDT | Losing streak table |
| 3 | Size the position from the stop, including fees on both sides | 909.50 USDT (0.0114 BTC) | Position size calculator |
| 4 | Set the take profit, check risk reward and the break-even win rate after fees | 1:2 → target 81,600, profit 17.27 USDT, 36.67% win rate needed | Risk reward ratio |
| 5 | Choose leverage and margin mode, check that liquidation sits beyond the stop | 10x isolated: 90.95 USDT margin, liquidation 72,400 | Liquidation price calculator |
| 6 | Add up the risk on open trades and compare with daily and weekly limits | One 1% trade already open → 2% total if both hit their stops | Loss limits section below |
| 7 | Log the trade before you click: reason, stop, risk in R | 1R = 10 USDT | Trading journal |
The first three steps follow the order of the 1% rule: set the stop first, size the trade first, and only then click. Changing the order, for example picking the margin first and multiplying by leverage, is how a loss quietly grows past 1%. Step 4 is also when you price the cost of holding: holding a long for 7 days with the funding rate at +0.05% every 8 hours costs about 9.55 USDT, nearly the whole 10 USDT risk budget. Base-tier trading fees on major platforms are listed on the futures exchange fees page.
How do you calculate position size at 1% risk?
Position size at 1% risk is the amount you accept to lose divided by the distance to the stop (in %) plus the entry and exit fees: Position size = (Account × Risk %) ÷ (Stop distance % + Entry fee % + Exit fee %). The exit fee is charged at the stop price, so a long and a short have slightly different sizes even with the same stop distance:
- BTC long at 80,000, stop at 79,200: 10 ÷ (1% + 0.05% + 0.0495%) ≈ 909.50 USDT.
- BTC short at 80,000, stop at 80,800: 10 ÷ (1% + 0.05% + 0.0505%) ≈ 908.68 USDT.
- 100 USDT account, same long: 1 ÷ 1.0995% ≈ 90.95 USDT.
In all three trades, hitting the stop costs exactly 1% of the account including fees. Fees make up about 9% of the loss with a 1% stop, so ignoring them pushes you past the risk you chose. Where to place the stop and the common mistakes are in the stop loss guide; the differences between the two sides are in long vs short in crypto.
Where do leverage, margin and liquidation fit in risk management?
In risk management, leverage only decides how much margin you lock and how far away liquidation is; it does not decide what you lose at the stop, as long as the position size comes from the stop. The one hard condition is that the stop must come before the liquidation price. For the 909.50 USDT example trade, isolated margin, 0.5% maintenance margin:
- 10x: 90.95 USDT of margin (9.10% of the account), estimated liquidation at 72,400, 6,800 USDT beyond the stop.
- 50x: 18.19 USDT of margin, liquidation at 78,800, only 400 USDT beyond the stop.
- 100x: 9.10 USDT of margin, liquidation at 79,600, before the 79,200 stop, so the trade is liquidated first.
The boundary for a 1% stop is about 66.67x. The full table by stop distance is in crypto leverage explained; how the liquidation price is formed is in what is liquidation price.
Margin mode decides the maximum loss when things go wrong, for example a forgotten stop or price slipping through it. With isolated margin at 10x, the most the example trade can lose is its 90.95 USDT of margin. With cross margin, the account’s available balance also absorbs losses, so liquidation sits further away but the maximum loss can be that whole balance. The full comparison, including when to use each mode, is in isolated vs cross margin. The site’s liquidation price calculator only estimates isolated margin.
What are total open risk and daily or weekly loss limits?
Total open risk is what you lose if every open trade hits its stop at the same time, and a daily or weekly loss limit is the loss at which you stop opening new trades for the rest of that period. The 1% rule only limits each trade; these two limits cap the whole account.
On a 1,000 USDT account with 1% risk per trade:
- Two trades open at once (for example a BTC long and an ETH long): if price moves against both and both stops are hit, the account loses 20 USDT, or 2%.
- Three losses in a row in one day: the balance is 970.30 USDT, down 2.97%.
- Six losses in a row in one week: the balance is 941.48 USDT, down 5.85%.
These numbers are examples of how a limit works, not a standard level for everyone. One easy way to set a limit is in R, where 1R is the risk of one trade: “stop for the day at minus 3R” means three losses in a row and you close the platform. A daily limit helps most with a common first-year mistake: revenge trading after a loss, and refusing to stop out of stubbornness. A stopping rule set in advance, while calm, does the job that willpower cannot do in the middle of a losing day.
What do risk reward and expectancy tell you about risk management?
The risk reward ratio tells you the minimum share of trades you must win to break even, and expectancy tells you how much each trade makes or loses on average once you combine risk reward with your real win rate. The example trade at 1:2 takes profit at 81,600 for 17.27 USDT after fees and loses 10 USDT at the stop, so the break-even win rate is 36.67%.
Expectancy per trade = Win rate × Average win − Loss rate × Average loss. Same 1:2 example trade:
| Win rate | Expectancy per trade | In R | After 100 trades (fixed 10 USDT risk) |
|---|---|---|---|
| 30% | −1.82 USDT | −0.18R | −181.86 USDT |
| 35% | −0.45 USDT | −0.05R | −45.50 USDT |
| 40% | +0.91 USDT | +0.09R | +90.86 USDT |
| 45% | +2.27 USDT | +0.23R | +227.22 USDT |
The rows either side of 36.67% show that the same risk reward ratio can lose or make money depending on your real win rate. The win rates in the table are assumptions for illustration, not results from any specific system. The break-even table for 1:1, 1:1.5, 1:2 and 1:3, and how risk reward changes when you move the stop or take partial profit, is in the risk reward ratio guide. Read P&L in USDT and as a % of the account, not as ROE; the reason is in PnL and ROE in crypto.
How does a trading journal support risk management?
A trading journal turns risk management from an intention into a measurement: logging every trade in R gives you your real win rate, real expectancy and real drawdown, the three numbers the tables above can only assume. Without a journal, you do not know which row of the expectancy table you are on.
A journal that works for risk management has at least these columns:
- Plan: date, pair, side, entry, stop loss, take profit, position size, risk in R.
- Result: exit price, fees, net P&L in USDT, result in R.
- Behavior: reason for entry, emotion at entry, mistakes if any (moved the stop, oversized, broke the daily limit).
The behavior columns are the ones most people skip. Practicing noticing greed, anger and delusion in yourself pays off here, because the chart reflects a state of mind surprisingly clearly: greedy, a trader wants a bigger position; scared, a trader cuts too early. How to log trades, calculate results in R, run a weekly review and download a template is in the trading journal guide.
What are the most common risk management mistakes?
The five most common risk management mistakes are sizing up to win back a loss, moving the stop further away when price goes against you, picking margin first and multiplying by leverage, judging trades by ROE, and holding positions without pricing funding. Each one breaks a different step of the 7-step process:
- Sizing up to win it back (breaks step 2): after 3 losses at 1%, a 5% trade to “get it back” accepts a 48.51 USDT loss on a 970.30 USDT balance, 5 times the planned 1% (9.70 USDT).
- Moving the stop further away (breaks steps 1 and 3): keeping 909.50 USDT but moving the stop from 79,200 to 78,400 raises the loss to about 19.09 USDT, nearly double 1%. Details in the stop loss guide.
- Picking margin first and multiplying by leverage (breaks steps 3 and 5): 100 USDT of margin at 20x is a 2,000 USDT position, and a 1% stop costs 21.99 USDT. Details in crypto leverage explained.
- Judging trades by ROE (breaks step 4): +37.98% ROE at 20x and +9.50% at 5x are the same 17.27 USDT, or 1.73% of the account. Details in PnL and ROE in crypto.
- Holding without pricing funding (breaks step 4): accumulated funding can eat the whole risk budget before price reaches the stop. The mechanism is in what are perpetual futures.
One more mistake sits outside any single trade: opening several high-leverage positions when the market is crowded on one side. When many positions are liquidated at once, price can slip through your stop; what is open interest explains liquidation cascades.
Use the position size calculator before every trade
The position size calculator at 1% risk puts steps 2, 3, 4 and 5 of the process on one screen: enter account size, risk %, entry, stop loss, leverage and fees, and it returns position size, margin, the share of your account locked, the estimated liquidation price, a warning when liquidation sits before the stop, and a take-profit table from 1:1 to 1:10 with profit after fees. Use it before every trade. For market context before you enter, such as funding and open interest, check the data dashboard.
This content is for educational purposes only and is not investment advice. Trading derivatives carries the risk of losing your entire margin.
FAQ
Is risk management the same as money management in trading?
In futures trading the two terms are often used interchangeably. If you separate them, risk management decides what a wrong trade costs (the stop and the risk percentage), while money management is broader: it also covers position size, margin, total open risk, daily or weekly loss limits and recording results.
Does a small 100 USDT account need risk management?
Yes, and the math is identical. 1% of 100 USDT is 1 USDT; for a BTC long at 80,000 with a stop at 79,200 and a 0.05% fee per side, the position size is 90.95 USDT and the margin at 10x is only 9.10 USDT. A small account is the cheapest place to practice the process before the balance grows.
Should you raise your risk percentage during a winning streak?
When risk is a percentage of the current balance, the USDT amount per trade already grows with the account, so the percentage does not need to change. Raising it after a winning streak deepens the drawdown of the next losing streak: at 2% per trade, 12 losses in a row already take the account down more than 20%, against 23 losses at 1%.
Is moving the stop to break-even good risk management?
Moving the stop to the entry price cuts the remaining risk of the trade to roughly the fees, but it also makes the trade easier to close on normal price noise. It is a trade-management choice and does not replace sizing the position correctly at the start. How that choice changes the risk reward ratio is covered in the risk reward guide.
Derivatives trading can lose you your entire margin. See the disclaimer.