 RonOnCrypto
Risk Reward Ratio: How to Calculate It, the Break-Even Win Rate and Expectancy
On this page · 9
- What is the risk reward ratio in trading?
- How do you calculate the risk reward ratio?
- What win rate do you need to break even?
- How much do fees reduce the real risk reward ratio?
- What is trading expectancy and how do you calculate it?
- How does moving your stop loss change the risk reward ratio?
- How do partial take profits affect the risk reward ratio?
- What is a good risk reward ratio?
- Use the position size calculator to see R:R before you enter
- Break-even win rate, before fees
- -
- Break-even win rate, after 0.05% fees per side
- -
- Expectancy per trade, after fees
- -
- After 100 trades like this
- -
The risk reward ratio (R:R) compares what you can lose if price hits your stop loss with what you can make if price hits your take profit: a 1:2 risk reward ratio means risking 1 unit to make 2. It decides the minimum share of trades you must win to avoid losing money. Before fees the break-even win rate is 1 ÷ (1 + R), so 1:2 needs a 33.33% win rate; after a 0.05% fee per side, it rises to 36.67% in this guide’s example.
This guide covers, in order: what R:R measures, how to calculate it, the break-even win rate before and after fees, how much fees cut the real ratio, expectancy per trade, R:R when you move the stop and when you take partial profits, and how much R:R is enough. The short version: R:R only means something next to your own real win rate, recorded over many trades.
| Key facts | Value in this guide’s example |
|---|---|
| R:R formula (long) | R = (Take profit − Entry) ÷ (Entry − Stop loss) |
| Break-even win rate before fees | 1 ÷ (1 + R) |
| Expectancy per trade | Win rate × Average win − Loss rate × Average loss |
| Example trade | BTC long at 80,000, stop 79,200 (1% away), 1,000 USDT account, 1% risk |
| Position size (0.05% fee per side) | 909.50 USDT, exactly 10 USDT lost at the stop |
| Break-even after fees at 1:1 / 1:1.5 / 1:2 / 1:3 | 55.00% / 44.00% / 36.67% / 27.50% |
What is the risk reward ratio in trading?
The risk reward ratio in trading compares the distance from entry to stop loss (the risk) with the distance from entry to take profit (the reward), written as 1:R. The risk part is often called “1R”: with a 1,000 USDT account at 1% risk, 1R is 10 USDT. A 1:2 trade puts the take profit twice as far from entry as the stop; in this guide’s example that is about 17.27 USDT of profit after fees against 10 USDT of risk.
The ratio has three inputs, set in this order:
- Stop loss: placed from price structure, at the level where your reason for the trade is no longer valid. How to place it is in the stop loss guide.
- Position size: calculated from the stop so that 1R equals the risk you chose.
- Take profit: placed at a sensible price target, then measured in R.
The stop comes first because it defines 1R. After a losing first year, the useful shift is to stop asking “how much can this trade make” and start asking “how much is lost if this trade is wrong”, as explained on the about page.
How do you calculate the risk reward ratio?
To calculate the risk reward ratio for a long, divide the distance from entry to take profit by the distance from entry to stop loss; for a short, reverse both distances. Example: a BTC long at 80,000 USDT, stop loss at 79,200, take profit at 81,600:
- Risk in price: 80,000 − 79,200 = 800 USDT per BTC (1%).
- Reward in price: 81,600 − 80,000 = 1,600 USDT per BTC (2%).
- R = 1,600 ÷ 800 = 2, so the trade is 1:2.
In money, with a 909.50 USDT position (about 0.0114 BTC) and a 0.05% fee per side, the stop costs exactly 10 USDT including fees and the target pays about 17.27 USDT after fees. Measured in real money the ratio is 10 : 17.27, about 1:1.73, not 1:2. The gap is fees: about 0.90 USDT of fees sits inside the 10 USDT loss, and about 0.92 USDT is taken out of the win.
For a short: R = (Entry − Take profit) ÷ (Stop loss − Entry). Sizing for both directions is covered in long vs short in crypto.
What win rate do you need to break even?
The break-even win rate before fees is 1 ÷ (1 + R); after fees it is Loss per trade ÷ (Loss per trade + Net win per trade). At that win rate, the winners exactly pay for the losers. The table uses the example BTC long at 80,000, stop at 79,200, a 909.50 USDT position and a 10 USDT loss per losing trade including fees:
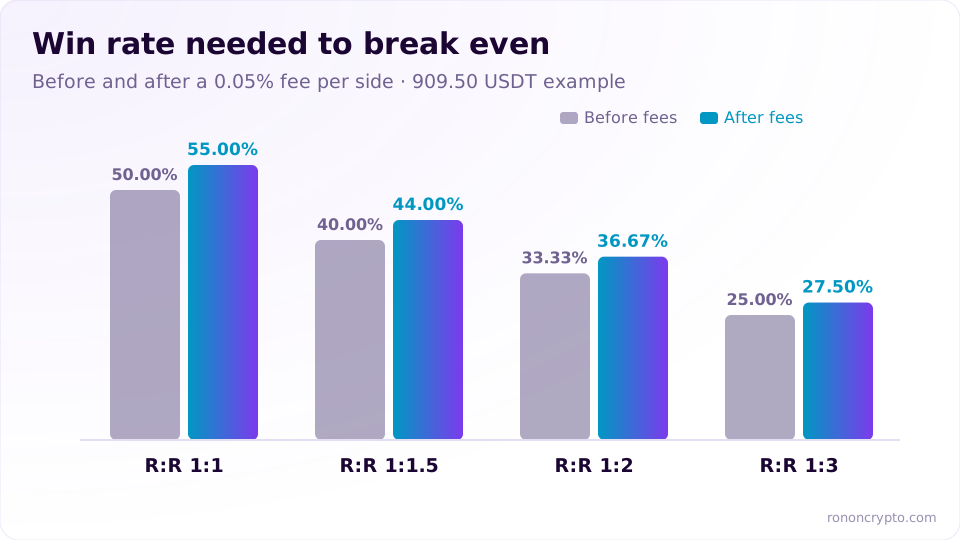
| R:R | Take profit (long from 80,000) | Net win after fees | Break-even win rate (before fees) | Break-even win rate (after fees) |
|---|---|---|---|---|
| 1:1 | 80,800 | 8.18 USDT | 50.00% | 55.00% |
| 1:1.5 | 81,200 | 12.73 USDT | 40.00% | 44.00% |
| 1:2 | 81,600 | 17.27 USDT | 33.33% | 36.67% |
| 1:3 | 82,400 | 26.36 USDT | 25.00% | 27.50% |
At 1:5 (take profit 84,000), break-even after fees is 18.33%. These are floors, not targets: win exactly at break-even and the account goes nowhere after many trades. The stop loss guide summarises these levels for the same example trade.
How much do fees reduce the real risk reward ratio?
Fees make the real risk reward ratio lower than the price-based ratio, and the tighter the stop, the bigger the share fees take, so the break-even win rate climbs fast. The reason: position size grows as the stop gets tighter, and fees are charged on position size. Two BTC longs at 80,000, both risking 10 USDT, 0.05% fee per side:
| Stop loss | Position size | R:R by price | Net win after fees | Break-even win rate (after fees) |
|---|---|---|---|---|
| 79,200 (1% away) | 909.50 USDT | 1:2 | 17.27 USDT | 36.67% |
| 79,840 (0.2% away) | 3,334.44 USDT | 1:2 | 10.00 USDT | 50.01% |
With a 0.2% stop, a “1:2” trade on paper needs to win about half the time just to break even, close to a 1:1 trade with no fees at all; a 1:1 trade with the same stop needs 75.01%. Fee rates differ by platform and order type; official base-tier rates are listed on the futures exchange fees compared page. Cost your own trade with the trading fee calculator and see net P&L with the PnL and ROE calculator.
What is trading expectancy and how do you calculate it?
Trading expectancy is the average amount you make or lose per trade over many trades: Expectancy = Win rate × Average win − Loss rate × Average loss. It is the expected value from probability theory, a weighted average of outcomes, according to Wikipedia, Expected value (accessed 25 October 2026). Positive expectancy means the approach makes money as long as the win rate holds; negative expectancy means more trades lose more.
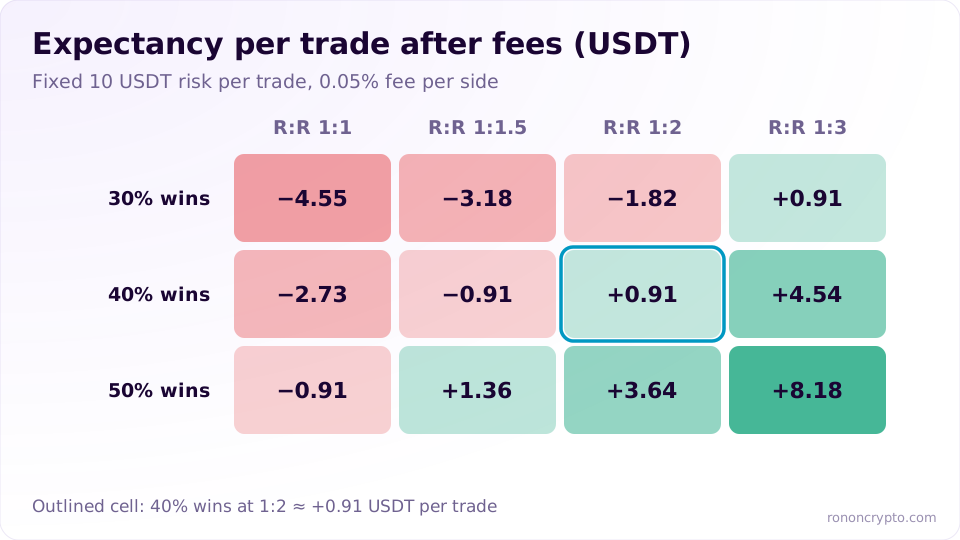
Example: a 40% win rate at 1:2, with a fixed 10 USDT risk per trade:
- Expectancy = 0.4 × 17.27 − 0.6 × 10 ≈ +0.91 USDT per trade, or about +0.09R.
- Over 100 trades: 40 winners make about 690.86 USDT, 60 losers cost 600 USDT, leaving about +90.86 USDT.
- Before fees, the same approach would show +0.2R per trade. Fees take more than half.
Expectancy after fees, in USDT per trade, for the same example trade (divide by 10 for R):
| Win rate | 1:1 | 1:1.5 | 1:2 | 1:3 |
|---|---|---|---|---|
| 30% | −4.55 | −3.18 | −1.82 | +0.91 |
| 40% | −2.73 | −0.91 | +0.91 | +4.54 |
| 50% | −0.91 | +1.36 | +3.64 | +8.18 |
One detail is worth a second look: at exactly the before-fee break-even (50% at 1:1, 40% at 1:1.5, 25% at 1:3), each trade still loses about 0.91 USDT on average, roughly one round trip of fees. Win rate and average win must come from your own trades; the trading journal guide shows how to record results in R and work out expectancy each week.
How does moving your stop loss change the risk reward ratio?
Moving the stop further away while keeping the same size makes 1R bigger, so the ratio gets worse and the break-even win rate rises; moving the stop to entry leaves only fees at risk. Three cases for the BTC long at 80,000 with a take profit at 81,600:
- Stop moved further, same size: keep 909.50 USDT and move the stop from 79,200 to 78,400 (2% away). The stop now costs about 19.09 USDT, almost double the 1% plan. The win at 81,600 is still 17.27 USDT, so the real ratio drops to about 1:0.90 and you need about a 52.50% win rate to break even.
- Wide stop from the start, size recalculated: if structure calls for a stop at 78,400 from the moment you enter, the 1% risk size is about 476.42 USDT. The 1:2 target is then 83,200, paying about 18.57 USDT after fees, with break-even at about 35.00%.
- Stop moved to entry: after price moves in your favor, move the stop to 80,000. If it is hit, the trade loses only about 0.91 USDT in fees instead of 10 USDT, but a normal pullback can also close it early.
The first case is exactly the common first-year habit of “holding losers out of an unwillingness to admit being wrong”. The math shows the price: a trade with a moved stop is no longer a 1:2 trade.
How do partial take profits affect the risk reward ratio?
Partial take profits split the position into pieces with different ratios, and the trade’s result is the weighted sum of the pieces; it does not make the trade better by itself. Example: the 909.50 USDT long at 80,000 with a stop at 79,200 closes 50% at 80,800 (1:1) for about 4.09 USDT after fees, and the rest goes one of three ways:
| Remaining 50% | Result of the remaining half | Whole trade | In R |
|---|---|---|---|
| Closed at 82,400 (1:3) | +13.18 USDT | +17.27 USDT | +1.73R |
| Stop moved to 80,000, hit | −0.45 USDT | +3.64 USDT | +0.36R |
| Stop left at 79,200, hit | −5.00 USDT | −0.91 USDT | −0.09R |
The first row gives exactly 17.27 USDT, the same as closing everything at 1:2: half at 1:1 and half at 1:3 average out to 1:2. What partials change is the spread of outcomes, fewer full 1R losses but smaller winners. To know which approach suits you, compare the expectancy of both in a journal of real trades, not on a single trade.
What is a good risk reward ratio?
There is no single good risk reward ratio for everyone; a good ratio is one where your real win rate at that ratio sits clearly above the after-fee break-even. A higher ratio usually comes with a lower win rate, because a distant target is hit less often. Check three things together:
- Your real win rate for that type of trade, recorded over many trades.
- Fees and funding, especially with tight stops or multi-day holds (see the funding rate guide).
- Your own habits: closing winners early makes the R you actually collect smaller than the R you planned.
That last point is where a trader shows most clearly on the chart: scared, they cut too early; greedy, they want a bigger position. A trade planned at 1:2 and closed at 1:1 out of fear belongs in the journal as 1:1. R:R is only one part of managing risk; the full picture, from the 1% rule to losing-streak limits, is in the crypto risk management guide.
Use the position size calculator to see R:R before you enter
The position size calculator at 1% risk includes an R:R target table: enter your account size, risk %, entry, stop, leverage and fees, and it returns the position size plus take-profit prices at 1:1, 1:2, 1:3, 1:5 and 1:10 with net profit after fees. For the example trade it shows 81,600 at 1:2 and about 17.27 USDT; divide by the 10 USDT risk and you have the real ratio to compare with your win rate.
This content is for educational purposes only and is not investment advice. Trading derivatives carries the risk of losing your entire margin.
FAQ
Are 1:2 and 2:1 the same risk reward ratio?
Usually they describe the same trade written in a different order. This guide and the calculator on this site put risk first, so 1:2 means risk 1 to make 2. Some sources write reward first (reward:risk) and call the same trade 2:1. Check which side comes first before you compare numbers between sources.
Is the risk reward ratio different for a short?
Hardly. A BTC short at 80,000 with a stop at 80,800 (1% away) risks 10 USDT with a size of about 908.68 USDT; a 1:2 target at 78,400 makes about 17.27 USDT after fees, and the break-even win rate is still about 36.67%. The small difference comes from the exit fee being charged at the exit price.
Does the funding rate change the risk reward ratio?
Yes, if you hold through funding timestamps. Funding is a cost or a credit charged on position value. Holding a 909.50 USDT long for 7 days at +0.05% every 8 hours costs about 9.55 USDT, almost the whole 10 USDT risk, so the net profit at your target shrinks by that amount.
Is it safer to only take trades at 1:3 or higher?
Not automatically. A target further away is usually reached less often. At 1:3, if you only win 25% of trades, the expectancy after fees is still about −0.91 USDT per trade. A high R:R only helps if your real win rate at that ratio stays above break-even.
Derivatives trading can lose you your entire margin. See the disclaimer.