 RonOnCrypto
Liquidation heatmap explained: how to read a liquidation map built from real Hyperliquid positions
On this page · 9
- What is a liquidation heatmap?
- Estimated liquidation maps vs real-position maps: what is the difference?
- Where does the RonOnCrypto liquidation map get its data?
- How to read a liquidation heatmap: BTC on the morning of 9 November 2026
- Why is price said to be “pulled” toward dense liquidation zones?
- What does a liquidation heatmap mean for your own trade?
- Common mistakes when reading a liquidation heatmap
- Checklist: using a liquidation heatmap before a trade
- Use the tool: open the Hyperliquid liquidation map on RonOnCrypto
Need leverage, liquidation price and take-profit targets? Open the full calculator.
A liquidation heatmap (liquidation map) is a chart that shows how much leveraged position size gets liquidated at each price if price travels there. Longs are liquidated when price falls, so they sit below the current price; shorts sit above it. Most liquidation heatmaps online are estimates: they take open interest and assume traders use a few common leverage settings. The RonOnCrypto map reads real positions: Hyperliquid makes every wallet’s positions public, so RonOnCrypto pulls the actual liquidation prices of wallets holding more than $1M and rescan them every hour.
This guide covers the definition, how estimated maps differ from maps built on real positions, where the RonOnCrypto map gets its data, how to read it with real data from the morning of 9 November 2026, why price is often said to be “pulled” toward dense liquidation zones, what the map means for your own trade, common mistakes and a checklist. The short answer: a liquidation heatmap tells you where leverage is stacked, not where price will go.
| Attribute | Value |
|---|---|
| Also called | Liquidation heatmap, liquidation map, liquidation levels |
| Main axes | Price, and the size waiting to be liquidated at each price |
| Quick read | Long liquidations below the current price, short liquidations above it |
| Two types | Estimated (open interest + assumed leverage) and real positions (only where an exchange makes positions public) |
| RonOnCrypto map | Hyperliquid, BTC and ETH, wallets over $1M, scanned hourly, $250 price steps for BTC |
| Does not tell you | Where or when price will move, or what the whole market holds |
What is a liquidation heatmap?
A liquidation heatmap stacks the liquidation prices of many leveraged positions on one price axis, so you can see which price zones hold many positions that would be force-closed. Every leveraged position has a liquidation price: the level at which the remaining margin falls to the maintenance margin and the platform closes the trade. How that number is calculated for one trade is covered in liquidation price explained; a liquidation heatmap adds hundreds of those numbers together.
A liquidation heatmap usually has three parts:
- Distribution by price: bars or a cumulative line showing the size waiting to be liquidated at each price step. A zone with tall bars or a steep cumulative line is often called a liquidation wall.
- Two sides: longs sit below the current price (they get liquidated if price falls there), shorts sit above it.
- Over time (the heatmap itself): each scan is one vertical column, and the brighter a price level, the more size is waiting to be liquidated there, drawn over the price candles.
Estimated liquidation maps vs real-position maps: what is the difference?
An estimated map guesses liquidation prices from open interest and a few assumed leverage settings, while a real-position map reads the liquidation price the exchange has already calculated for each position; the second kind only works on exchanges that make positions public, such as Hyperliquid. Centralized exchanges do not publish individual accounts’ positions, so map builders only see total open interest and have to assume where traders entered and with how much leverage.
CoinGlass, a large derivatives data site, states this plainly in the FAQ on its Liquidation Levels page: “The levels are estimated from open interest and common leverage settings; they are not resting orders.” The page models a long as liquidated near entry × (1 − 1 ÷ leverage) and a short near entry × (1 + 1 ÷ leverage), and estimates three common leverage settings separately because it “cannot know each trader’s leverage”. CoinGlass’s liquidation heatmap guide also notes that actual liquidation amounts “may be lower than the levels shown on the heatmap”. Both pages accessed 9 November 2026.
Hyperliquid works differently: its official API documentation has a section titled “Retrieve user’s perpetuals account summary” (the clearinghouseState request), which returns each open position of a wallet with its size (szi), margin used (marginUsed) and liquidation price (liquidationPx) (Hyperliquid Docs, Info endpoint, Perpetuals, accessed 9 November 2026).
| Estimated map | Real-position map (RonOnCrypto) | |
|---|---|---|
| Inputs | Open interest, price, assumed leverage | Each wallet’s positions and liquidation prices, as returned by the exchange |
| Liquidation price | Modelled with a formula | The exchange’s own number, cross margin included |
| Coverage | Often aggregates several exchanges | One exchange (Hyperliquid), wallets over $1M only |
| Strength | Broad market coverage | No leverage assumptions, position count at each level known |
| Weakness | Error from assumptions, no view of closed positions | Misses small wallets and every other exchange |
Neither type is “right” in absolute terms. An estimated map answers “where might leverage be stacked across the market”, a real-position map answers “where will the large wallets on Hyperliquid actually be liquidated”.
Where does the RonOnCrypto liquidation map get its data?
The RonOnCrypto Hyperliquid liquidation map takes all of its data from Hyperliquid’s public API: the leaderboard to pick wallets, each wallet’s positions for liquidation prices, the mark price and exchange-wide open interest, and 1-hour candles for the heatmap. The scan works like this (per the site’s data script, checked 9 November 2026):
- Pick wallets: take Hyperliquid’s public leaderboard and keep wallets with an account value above $1M. The full scan on the morning of 9 November 2026 found 2,547 of them.
- Full scan every 6 hours: read the positions of all 2,547 wallets and save the list of wallets holding BTC or ETH. The full scan at 00:12 UTC on 9 November 2026 found 396.
- Quick scan every hour: reread only those 396 wallets to refresh liquidation prices. A wallet that opens a position between two full scans does not appear until the next full scan.
- Group into price steps: liquidation prices are rounded to $250 steps for BTC and $10 for ETH. Positions with no liquidation price (wallets with enough margin) and positions that price has already moved past (stale data) are left off the map.
- Heatmap: each scan writes one column covering levels within ±20% of the mark price, kept for 30 days, alongside Hyperliquid 1-hour candles. Recording started on 31 October 2026.
The page is rebuilt every 3 hours, so the numbers on it can lag the latest scan by a few hours. If the latest scan is more than 6 hours old (for example after failed scans), the page shows a stale-data warning. If a scan reads fewer than 80% of the wallets it should, the script does not overwrite the previous data.
How to read a liquidation heatmap: BTC on the morning of 9 November 2026
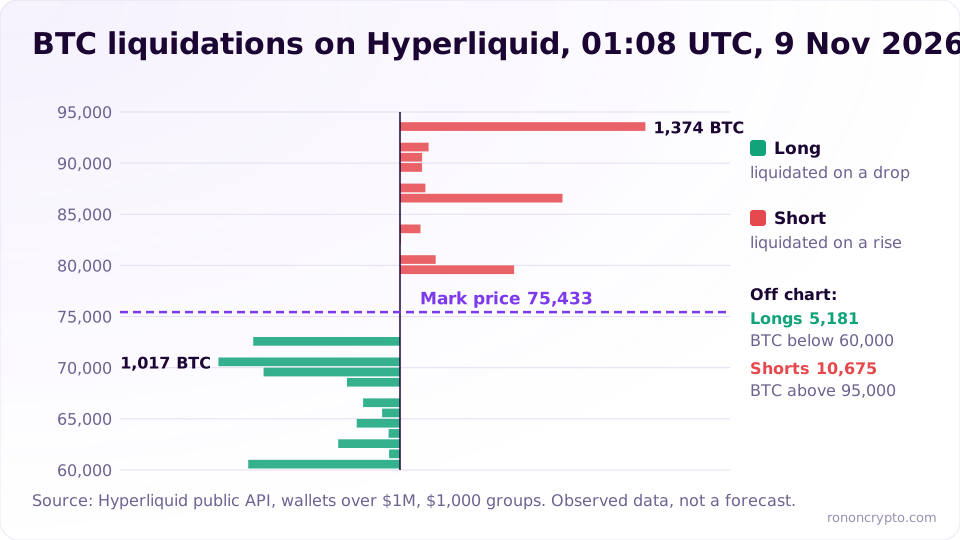
Read a liquidation heatmap in four steps: check total long and short size, find the nearest liquidation zone on each side, find the biggest wall, then use the heatmap to see whether that zone is new or has been there for days. The example below uses the BTC scan at 01:08 UTC on 9 November 2026 (08:08 Vietnam time), with a mark price of $75,433.
Total long and short size of the large wallets
At 01:08 UTC on 9 November 2026, the scanned large wallets held 10,403.65 BTC long and 14,466.59 BTC short, so 41.8% of the size was long. At the mark price, that is about $784.8M long and about $1.09B short. The position count was almost even: 150 long positions, 156 short positions.
This group is not the whole exchange. BTC open interest across Hyperliquid was 42,385 BTC at that moment, so the large wallets’ long side made up 24.5% of it and their short side 34.1%. The rest belongs to wallets under $1M that are not on the map. On top of that, 64 long positions (452.31 BTC, 4.3% of long size) had no liquidation price because their wallets held enough margin, so they do not appear in the distribution either.
Liquidation distribution by distance from price
Within 10% of the mark price, the long side had 2,899.34 BTC waiting to be liquidated, about 3.4 times the short side’s 843.96 BTC. The table groups the $250 steps by distance from the $75,433 mark price:
| Distance from mark price | Long liquidations (below price) | Long positions | Short liquidations (above price) | Short positions |
|---|---|---|---|---|
| 0–5% | 821.82 BTC (71,661–75,433) | 5 | 0 BTC (75,433–79,205) | 0 |
| 5–10% | 2,077.52 BTC (67,890–71,661) | 11 | 843.96 BTC (79,205–82,976) | 4 |
| 10–20% | 1,270.58 BTC (60,346–67,890) | 15 | 1,413.69 BTC (82,976–90,520) | 7 |
| 20–50% | 4,811.85 BTC | 33 | 3,423.65 BTC | 20 |
| Over 50% | 969.57 BTC | 22 | 8,785.30 BTC | 125 |
| Total on the map | 9,951.34 BTC | 86 | 14,466.59 BTC | 156 |
Two things stand out. Long liquidations sat closer to price: 29.1% of the long size on the map was within 10%, against only 5.8% of the short size. And 60.7% of the short size had liquidation prices more than 50% away from the mark price, meaning those large shorts used little leverage or had plenty of cross margin.
The nearest and the biggest liquidation walls
The nearest long liquidation level was the $72,500 step (−3.9% from the mark price), and the biggest long wall near price was the $72,000 step with 773.95 BTC from 2 positions, −4.6% from the mark price. The $72,000, $72,250 and $72,500 steps together held 821.82 BTC, about $62.0M at the mark price. Above price, the nearest short liquidation level was the $79,500 step with 638.96 BTC from 2 positions, +5.4% from the mark price.
The “largest liquidations” tables on the tool rank by size, not by distance. At 01:08 UTC, the largest long step was $51,750 (1,000 BTC, a single position, −31.4%) and the largest short step was $127,250 (2,654.6 BTC, 2 positions, +68.7%). A wall can be just one or two wallets, so the margin column and the position count matter as much as the size.
The heatmap: are liquidation zones standing still or moving?
The heatmap shows how long a liquidation zone has been in place: a bright band that runs for days is leverage sitting still, a new band means positions just opened or liquidation prices just moved. On the tool you pick a 3, 7 or 30-day window; each column is one scan, candles are Hyperliquid 1-hour prices, and the “Now” column on the right is the distribution from the latest scan. As of 9 November 2026 the BTC heatmap held 227 scans since 31 October 2026. A band can disappear because positions closed, were liquidated, or because a wallet added margin and pushed its liquidation price outside the ±20% window.
Why is price said to be “pulled” toward dense liquidation zones?
The common explanation is that a dense liquidation zone holds many positions that will be closed with market orders; when price reaches it, those forced orders push price further and can reach the next zone, which is called a liquidation cascade. A long liquidation is a forced sell and a short liquidation is a forced buy, so a large wall being hit can make price slip sharply within minutes.
That is an explanation, not a law. Three reasons not to treat a liquidation heatmap as a magnet:
- Price does not have to go there. The $72,000 zone at 01:08 UTC on 9 November 2026 is observed data about where leverage sat, not a forecast that price will get there.
- Walls move. With cross margin, liquidation prices shift when a wallet deposits, withdraws or wins and loses on other positions. A wall in one scan may be gone in the next.
- The map misses most of the market. The scanned large wallets made up only 24.5% of the long side and 34.1% of the short side of BTC open interest on one exchange. Centralized exchanges are not on this map.
What does a liquidation heatmap mean for your own trade?
A liquidation heatmap does not change how much you accept losing on a trade; what it helps with is checking whether your liquidation price and stop sit right inside a zone crowded with other liquidations. If your liquidation price sits inside a big wall, price reaching that zone tends to come with heavy slippage. That is why the stop has to sit before the liquidation price, far enough away for the stop to fill before the chaos.
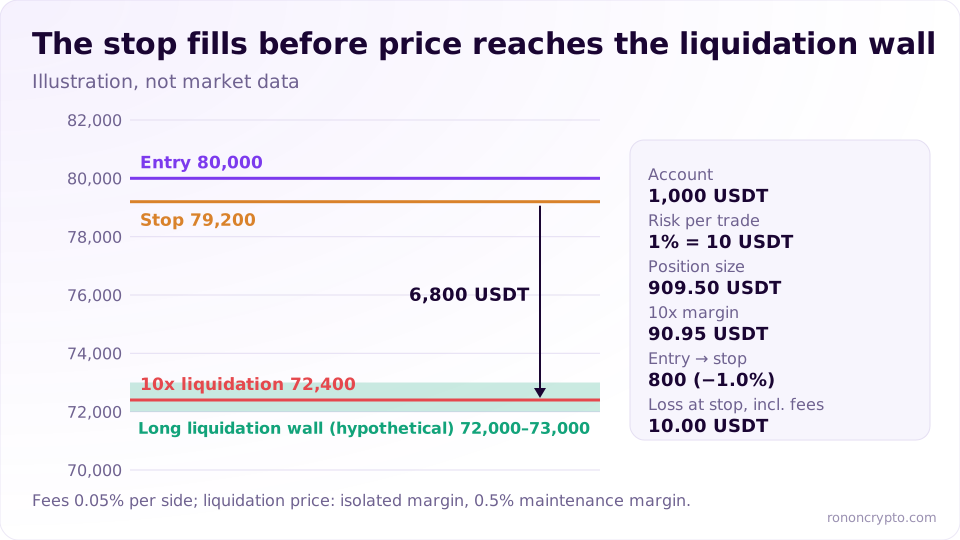
The site’s standard example: a 1,000 USDT account, 1% risk (10 USDT), a BTC long entered at 80,000, stop at 79,200, fees of 0.05% per side, 10x isolated margin (0.5% maintenance margin):
| Item | Value |
|---|---|
| Position size | 909.50 USDT (about 0.0114 BTC) |
| Margin at 10x | 90.95 USDT |
| Loss at the stop, fees included | 10.00 USDT |
| Stop distance | 800 USDT (1.0%) |
| Estimated liquidation price | 72,400 USDT (9.5% from entry) |
| Distance from stop to liquidation | 6,800 USDT |
Suppose the map shows a thick long wall in the 72,000–73,000 zone. This trade’s 72,400 liquidation price sits right inside it, but the 79,200 stop is 6,800 USDT above. If price goes the wrong way, the trade has already closed at 79,200 for a 10 USDT loss long before price reaches the wall. That is why size comes from the stop, while leverage only decides margin and where the liquidation price sits; more on that in the guide to crypto leverage. If you use cross margin, your liquidation price moves with your account balance just like the wallets on the map; see isolated vs cross margin. Fees are part of that 10 USDT; base-tier maker and taker fees on major platforms are listed on the futures exchange fees page.
What the map should not do is push your stop further away “to clear the wall” without recalculating size. A wider stop with the same size means losing more than 10 USDT when wrong. The rule is that no trade may cost more than 1% of the account, with the stop and the size set before the click.
Common mistakes when reading a liquidation heatmap
The five common mistakes are treating the map as a forecast, treating one exchange as the whole market, ignoring the scan time, confusing size with headcount, and mixing estimated maps with real-position maps.
- Treating a wall as price’s destination. The map shows where leverage sits, not when or whether price gets there.
- Treating one exchange as the whole market. The RonOnCrypto map is wallets over $1M on Hyperliquid. To see whether positions are opening or closing more broadly, look at open interest.
- Ignoring the update time. Every scan time is printed on the page, and data older than 6 hours carries a warning. Cross-margin liquidation prices may already have moved.
- Confusing size with headcount. A 1,000 BTC step can be a single position. One wallet closing makes the wall vanish.
- Comparing an estimated map with a real-position map as if they were the same thing. They have different inputs and different coverage, so different numbers are normal.
Many traders lose more than they win in their first year because they enter trades out of fear of missing out. A bright liquidation wall easily triggers that reflex (“price is about to sweep this zone”), so the liquidation heatmap belongs under context data, not entry points.
Checklist: using a liquidation heatmap before a trade
The checklist for using a liquidation heatmap has 6 steps: check the scan time, check total long and short size, find the nearest zone on each side, check the heatmap, compare with your own trade’s liquidation price, then keep the 1% risk plan unchanged.
- Check the scan time: read the “Updated” line at the top of the page. If there is a more-than-6-hours warning, treat the levels as loose reference.
- Total long and short: which way the large wallets lean by size, and how much of exchange-wide open interest they represent.
- Nearest zones: how far, in percent, the nearest long zone below price and the nearest short zone above price sit.
- Heatmap, 3 to 7 days: has the zone been standing for days or did it just appear?
- Your trade: work out your liquidation price with the liquidation price calculator, and check that your stop sits before the liquidation price and not right inside a thick wall.
- Keep the plan: size the trade at 1% risk with the position size calculator. Whatever the map shows, the maximum loss stays 10 USDT on a 1,000 USDT account.
Use the tool: open the Hyperliquid liquidation map on RonOnCrypto
The Hyperliquid liquidation map has BTC and ETH tabs, each with four stat boxes (mark price, total long, total short, leaning side), a cumulative liquidation wall chart, two tables of the 10 largest liquidation levels on each side, a long/short bar by size and a 3, 7 and 30-day heatmap. Each table row shows the liquidation price, size, notional value in USD, margin and distance from the current price. To look at one specific wallet (positions, net PnL after fees and funding), paste its address into the Hyperliquid wallet tracker. On this page, the position size box lets you size a trade at 1% risk before you look at the map.
Educational content only, not investment advice or a trading signal. Derivatives trading uses leverage, and you can lose your entire margin.
FAQ
Does a liquidation heatmap tell you where Bitcoin will go?
No. A liquidation heatmap only shows at which prices many positions would be force-closed if price got there. Price does not have to reach those zones, and the levels themselves move when traders add or withdraw margin or close positions.
Why does the RonOnCrypto liquidation map only cover Hyperliquid?
Hyperliquid is an on-chain derivatives exchange whose public API returns each wallet's positions and liquidation prices. Positions on centralized exchanges are private, so any map of them has to be an estimate. The trade-off is that the RonOnCrypto map only reflects wallets over $1M on one exchange.
How often is the RonOnCrypto liquidation map updated?
Every hour it rescans the wallets that hold BTC or ETH positions, and every 6 hours it scans every wallet over $1M to pick up new ones. The page is rebuilt every 3 hours; if the data is more than 6 hours old, the page shows a warning.
How is a liquidation heatmap different from a liquidation price?
A liquidation price belongs to one position and comes from its entry, leverage and maintenance margin; a 10x long from 80,000 has an estimated liquidation price of 72,400. A liquidation heatmap stacks the liquidation prices of many positions to show which price zones they cluster in.
Derivatives trading can lose you your entire margin. See the disclaimer.