 RonOnCrypto
Crypto Fear and Greed Index explained: components, the 5 zones and how to read it with real data
On this page · 8
- What is the crypto Fear and Greed Index?
- What is the Fear and Greed Index made of?
- The 5 zones of the Fear and Greed Index
- Real data: 10 days of Fear and Greed vs the BTC price
- How to read the Fear and Greed Index with funding, OI and long/short
- Common mistakes when reading the Fear and Greed Index
- Checklist: using the Fear and Greed Index before a trade
- Use the tool: check the Fear and Greed Index in the daily brief
The crypto Fear and Greed Index is a number from 0 to 100 that alternative.me publishes every day to score crypto market sentiment, currently for Bitcoin only: 0 means extreme fear and 100 means extreme greed. The index is split into 5 zones: Extreme Fear, Fear, Neutral, Greed and Extreme Greed. On the morning of 9 November 2026 (07:00 Vietnam time) it read 29, in the Fear zone.
This guide covers the definition, the components and weights alternative.me publishes, the cut-offs for the 5 zones (with how many days each zone has taken up historically), 10 days of real data from the RonOnCrypto daily brief next to the BTC price, how to read the index with funding, open interest and the long/short ratio, common mistakes, and a checklist tied to the 1% risk rule. The short answer: the Fear and Greed Index summarizes what price and the crowd have already done, so it is context data, not an entry point.
| Attribute | Value |
|---|---|
| Also called | Crypto Fear and Greed Index, Bitcoin Fear and Greed Index, crypto sentiment index |
| Published by | alternative.me (Crypto Fear & Greed Index) |
| Scale | 0 (extreme fear) to 100 (extreme greed) |
| Frequency | Daily, stamped 00:00 UTC (07:00 Vietnam time) |
| Components | Volatility, momentum and volume, social media, surveys (paused), Bitcoin dominance, Google Trends |
| History | 3,200 daily values, 1 February 2018 to 9 November 2026 |
| Does not tell you | Whether price will rise or fall, or when it will turn |
What is the crypto Fear and Greed Index?
The crypto Fear and Greed Index is a sentiment indicator: it rolls several sources of price and crowd-behaviour data into a single number that says whether the market is fearful or greedy. alternative.me describes the idea simply: when the market rises, people get greedy and chase it (FOMO); when they see red numbers, many sell in an irrational reaction. The index tries to measure that emotion each day (alternative.me, Crypto Fear & Greed Index page, accessed 9 November 2026).
The index is not a price, not a volume figure and not a technical indicator calculated on one candle time frame like RSI. It is a composite score, and because most of its inputs are Bitcoin’s own price and volume data, it usually follows what price has just done. A day of sharp losses almost always pulls the index into fear the next day.
On RonOnCrypto, the index appears on the homepage, the crypto market data dashboard and the daily crypto market brief; all three take the number from alternative.me’s public API.
What is the Fear and Greed Index made of?
According to alternative.me’s methodology page (accessed 9 November 2026), the index combines 6 components: volatility 25%, market momentum and volume 25%, social media 15%, surveys 15%, Bitcoin dominance 10% and search trends 10%. The surveys component is marked as currently paused.
| Component | Published weight | What alternative.me measures | Note |
|---|---|---|---|
| Volatility | 25% | Bitcoin’s current volatility and maximum drawdowns, compared with 30-day and 90-day averages | An unusual rise in volatility is read as fear |
| Market momentum and volume | 25% | Current volume and momentum compared with 30-day and 90-day averages | High buying volume in a rising market is read as greed |
| Social media | 15% | Counts Twitter posts on coin hashtags and how fast and how many interactions they get | Reddit sentiment analysis is not yet in the live index |
| Surveys | 15% | Weekly polls through strawpoll.com | Currently paused |
| Bitcoin dominance | 10% | Bitcoin’s share of total crypto market cap | Rising dominance is read as fear: a pullback from too speculative altcoin bets |
| Trends | 10% | Google Trends data for Bitcoin-related search queries | Changes in search volume |
Two things matter when reading this table. First, surveys still carry a listed 15% weight while paused, and the methodology page does not say how that 15% is redistributed. Second, 50% of the weight (volatility plus momentum and volume) comes straight from Bitcoin price and volume data over the past 30 to 90 days. That is why the index reacts quickly to what price has just done, and slowly or not at all to what price is about to do.
The 5 zones of the Fear and Greed Index
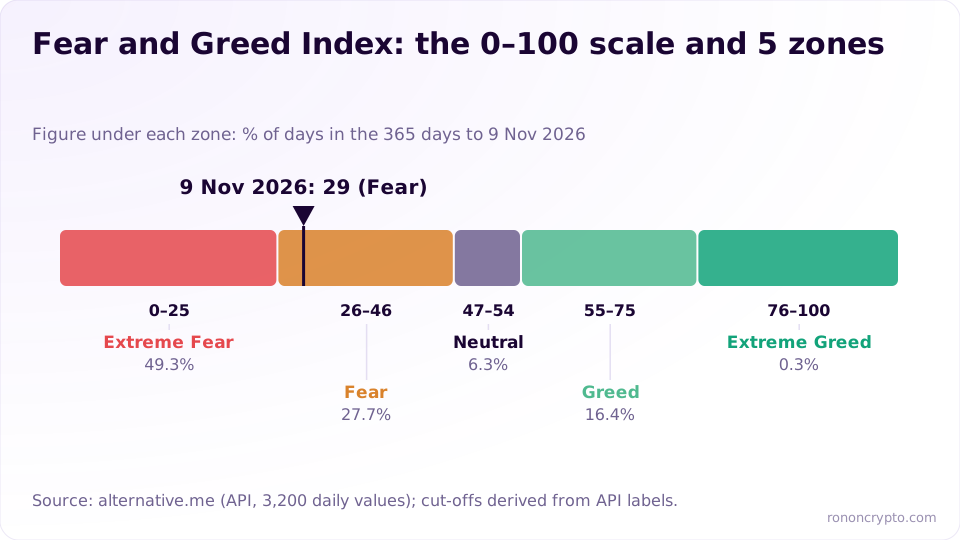
The index falls into 5 zones according to the labels alternative.me returns: Extreme Fear (0–25), Fear (26–46), Neutral (47–54), Greed (55–75) and Extreme Greed (76–100). The methodology page gives no numeric cut-offs; these are derived from the 3,200 labelled daily values alternative.me’s API returned from 1 February 2018 to 9 November 2026 (checked by RonOnCrypto on 9 November 2026). In all of that data, no value ever carried two different labels.
| Zone | Value range | Days (1 Feb 2018–9 Nov 2026) | % of days | Days in the last 365 | % of last 365 |
|---|---|---|---|---|---|
| Extreme Fear | 0–25 | 740 | 23.1% | 180 | 49.3% |
| Fear | 26–46 | 918 | 28.7% | 101 | 27.7% |
| Neutral | 47–54 | 411 | 12.8% | 23 | 6.3% |
| Greed | 55–75 | 849 | 26.5% | 60 | 16.4% |
| Extreme Greed | 76–100 | 282 | 8.8% | 1 | 0.3% |
The lowest value in the data is 5, the highest is 95, and the average is 45.7. The most striking column is the last one: in the 365 days to 9 November 2026, the index sat in extreme fear on almost half of all days and in extreme greed on just 1 day. The Neutral zone is the narrowest (8 values), so it also has the fewest days.
Reading each zone should stop at description:
- Extreme Fear (0–25): price has just fallen, volatility is high, the crowd is pessimistic. This describes the present; it does not flag a bottom.
- Fear (26–46): cautious sentiment, common after a drop or during a weak sideways stretch.
- Neutral (47–54): no emotion clearly dominates.
- Greed (55–75): price has just risen, buying volume is strong, the crowd is optimistic.
- Extreme Greed (76–100): a strong rally with many people chasing. Again a description, not a top signal.
alternative.me writes that extreme fear can be a sign investors are too worried and “could be a buying opportunity”, and that when investors are getting too greedy, the market is due for a correction. That is the index maker’s view. The 365-day data above shows extreme fear can last for months, so that view gives no timing.
Real data: 10 days of Fear and Greed vs the BTC price
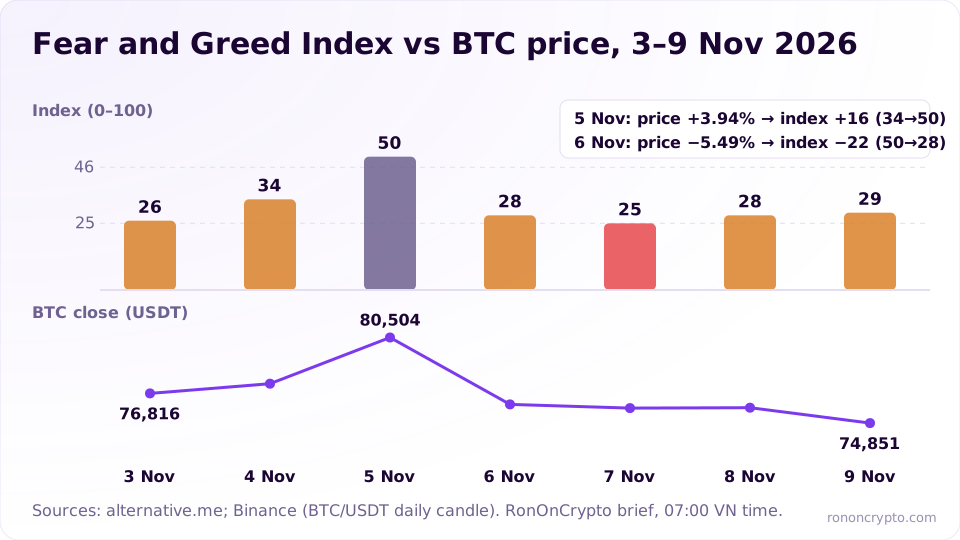
In the 10 daily briefs from 31 October to 9 November 2026, the Fear and Greed Index ranged from 25 to 50, averaged 32.1, and sat in Fear or Extreme Fear on 9 of the 10 days; over the same stretch the BTC close fell 3.25%, from 77,368.77 to 74,851.44. The data comes from the daily crypto market brief, each row taken at 07:00 Vietnam time. The index comes from alternative.me’s API; the closing price is the Binance BTC/USDT spot daily candle that closes at 07:00 Vietnam time on the date shown; funding, open interest and the long/short ratio come from the OKX BTC-USDT-SWAP contract.
| Date | Index | Zone | Change | BTC close | 24h | Funding (8h) | Open interest | Long/short (accounts) |
|---|---|---|---|---|---|---|---|---|
| 31 Oct | 30 | Fear | 0 | 77,368.77 | −0.80% | 0.0100% | $2.70B | 2.81 |
| 1 Nov | 34 | Fear | +4 | 77,582.02 | +0.28% | 0.0100% | $2.68B | 2.50 |
| 2 Nov | 37 | Fear | +3 | 78,354.00 | +1.00% | 0.0100% | $2.64B | 2.23 |
| 3 Nov | 26 | Fear | −11 | 76,816.00 | −1.96% | 0.0100% | $2.63B | 2.63 |
| 4 Nov | 34 | Fear | +8 | 77,453.86 | +0.83% | 0.0100% | $2.51B | 2.29 |
| 5 Nov | 50 | Neutral | +16 | 80,504.01 | +3.94% | 0.0075% | $2.68B | 1.40 |
| 6 Nov | 28 | Fear | −22 | 76,088.01 | −5.49% | 0.0028% | $2.65B | 2.82 |
| 7 Nov | 25 | Extreme Fear | −3 | 75,844.00 | −0.32% | 0.0064% | $2.63B | 2.90 |
| 8 Nov | 28 | Fear | +3 | 75,867.59 | +0.03% | 0.0091% | $2.61B | 2.84 |
| 9 Nov | 29 | Fear | +1 | 74,851.44 | −1.34% | 0.0021% | $2.52B | 2.65 |
The “Index change” for 31 October is measured against 30 October, when the index was also 30.
The 5 and 6 November rows show clearly how the index follows price. On the day the close rose 3.94%, the index jumped 16 points from 34 to 50, into Neutral. The next day price fell 5.49% and the index dropped 22 points to 28. The same thing happened on 30 October, outside the table: price fell 4.12% and the index dropped from 51 to 30. The index did not warn of any of these moves; it updated after price had already moved.
Zooming out, across the 17 briefs from 24 October to 9 November 2026 the index ranged from 25 to 54 and averaged 38.6, with 7 Neutral days, 9 Fear days and 1 Extreme Fear day; the BTC close fell 7.81% over the same period.
How to read the Fear and Greed Index with funding, OI and long/short
The Fear and Greed Index shows general sentiment, while funding, open interest and the long/short ratio show what leveraged traders are actually doing; when the two groups of numbers disagree, the leverage side is usually more telling. The 10 days above contain at least three such cases.
| Data | Measures | Observed 31 Oct–9 Nov 2026 |
|---|---|---|
| Fear and Greed Index | General sentiment, mostly from Bitcoin price and volume | 25–50, fear zones on 9 of 10 days |
| Funding rate | Which side pays to hold positions | Positive all 10 days; from 5 to 9 November below the 0.01% baseline, lowest 0.0021% |
| Open interest | Whether positions are being added or closed | Down 5.89% from 5 to 9 November, from $2.68B to $2.52B |
| Long/short ratio (accounts) | Which side has more traders | 1.40 on the Neutral day (5 Nov), 2.65–2.90 on the four fear days after it |
Funding: the crowd was fearful, yet BTC funding stayed positive, so longs were still paying shorts. Funding only dropped below baseline; it never turned negative. Fearful sentiment did not mean shorts dominated in money terms. How to read funding in detail is in crypto funding rates explained.
Open interest: from 5 to 9 November, price fell and USD-denominated OI fell 5.89%. Part of that drop comes simply from the lower price shrinking the dollar value of the same contracts; the rest is positions being closed, by choice or by liquidation. The four open interest and price scenarios are in the guide to open interest.
Long/short: across the 17 briefs, the 10 fear days had an average account long/short ratio of 2.61, while the 7 Neutral days averaged 1.93. In other words, on the days the crowd was scored as “fearful”, more OKX accounts were holding longs relative to shorts. A common explanation (an inference this data cannot confirm) is that many small accounts open longs into a drop. The ratio counts traders, not money; see the guide to the long short ratio.
These three leverage numbers and the Fear and Greed Index all sit in the 7-day BTC table in the daily brief, snapshotted at the same 07:00 Vietnam time, so you can compare them day by day.
Common mistakes when reading the Fear and Greed Index
The most common mistake is treating extreme fear as the bottom and extreme greed as the top; in the 365 days to 9 November 2026, extreme fear covered 49.3% of all days, so it does not point to any specific moment.
- “Extreme fear is the bottom.” A zone lasting 180 of 365 days is not a bottom. “Be greedy when others are fearful” is an investing view, not an entry rule, and it tells you neither when to enter nor where to place a stop.
- Reading the index as a forecast. 50% of the weight comes from volatility, momentum and volume over the past 30 to 90 days. The index summarizes what has happened; the 5 and 6 November example above shows it lags price.
- Ignoring the paused component. Surveys are still listed at 15% but are paused, and the redistribution of that weight is not published. You cannot rebuild alternative.me’s number from its components yourself.
- Using it for altcoins as if they were Bitcoin. Volatility, momentum and dominance are all measured on Bitcoin.
- Reading one number on its own. A reading of 29 only means something next to its own last 7 to 10 days and next to funding, OI and long/short.
A common scenario in the first year of trading BTC and ETH perpetual futures: more losses than wins, mostly because of emotion: entering out of fear of missing out, wanting a bigger position when greedy, cutting too early when scared (the full story is on the about page). The Fear and Greed Index measures exactly those two emotions at crowd level, so it easily triggers the very reflexes to avoid: buying the dip on “fear”, chasing on “greed”. That is why this number belongs with context data, not reasons to enter a trade.
Checklist: using the Fear and Greed Index before a trade
The checklist for using the Fear and Greed Index has 6 steps: check the value and zone, compare with the last 7 to 10 days, cross-check price, cross-check funding and OI, cross-check long/short, then keep the 1% risk plan unchanged. The index should never change how much money you accept losing on a trade.
- Check the value and zone: today’s number and its label, from the daily brief or the dashboard.
- Compare with itself: where the index sits within its last 7 to 10 days, and whether it is rising or falling.
- Cross-check price: did the index swing hard just because of one big price day before it?
- Cross-check funding and OI: a fearful crowd with positive funding means longs are still paying; falling OI means positions are leaving the market.
- Cross-check long/short: a fear day with a high account long/short ratio means most accounts are still holding longs.
- Keep the trade plan unchanged: stop set first, size worked out from 1% risk, liquidation price checked to sit far from the stop.
Step 6 with a 1,000 USDT account, 1% risk (10 USDT), a BTC long entered at 80,000, stop at 79,200, fees of 0.05% per side, 10x isolated margin:
| Item | Value |
|---|---|
| Position size | 909.50 USDT (about 0.0114 BTC) |
| Margin at 10x | 90.95 USDT |
| Loss at the stop, fees included | 10.00 USDT |
| Estimated liquidation price (0.5% maintenance margin) | 72,400 USDT |
| Distance from stop to liquidation | 6,800 USDT |
Whether the index reads 25 or 75, every number in that table stays the same, because size comes from the distance between entry and stop, not from market sentiment. The rule is that no trade may cost more than 1% of the account, with the stop and the size set before the click. Fees are part of that 10 USDT; base-tier maker and taker fees on major platforms are listed on the futures exchange fees page. Turning the rule into a process is covered in the crypto risk management guide, and placing a stop based on price structure is in the guide to stop loss in crypto. If you want to know how emotion affects your own trades, the emotion column in a trading journal measures that better than any crowd index.
Use the tool: check the Fear and Greed Index in the daily brief
The daily crypto market brief has a 7-day BTC table that puts the Fear and Greed Index next to the closing price, funding, open interest and long/short ratio, snapshotted at 07:00 Vietnam time; today’s snapshot also covers ETH and SOL. Because every column shares one timestamp, you can see day by day whether the index moved with or against the leverage numbers. A simple routine: check the index and its direction over 7 days, cross-check funding and OI, open the crypto market data dashboard for live numbers, and only then plan the trade. Before any trade, size it at 1% risk with the position size calculator.
Educational content only, not investment advice or a trading signal. Derivatives trading uses leverage, and you can lose your entire margin.
FAQ
What number counts as extreme fear on the Fear and Greed Index?
alternative.me does not list numeric cut-offs on its methodology page. Across the 3,200 daily values its API returned from 1 February 2018 to 9 November 2026, the Extreme Fear label always came with values of 25 or below, Fear with 26 to 46, Neutral with 47 to 54, Greed with 55 to 75 and Extreme Greed with 76 and above.
When does the crypto Fear and Greed Index update?
alternative.me updates the index daily, and each API value is stamped 00:00 UTC (07:00 Vietnam time). The RonOnCrypto daily brief takes its snapshot at exactly 07:00 Vietnam time, so the value in the brief matches the value alternative.me publishes for that day.
Is extreme fear a signal to buy the bottom?
Nothing guarantees that. In the 365 days to 9 November 2026 the index was in extreme fear on 180 days, or 49.3% of the time. A zone that covers almost half a year cannot point to one specific bottom; the index describes current sentiment, not where price goes next.
Does the Fear and Greed Index work for altcoins?
alternative.me states that the current index is for Bitcoin only: volatility, momentum and dominance are all measured on Bitcoin. Altcoins usually move in the same direction as Bitcoin but with different swings, so use the index as general context, not as a gauge for a single altcoin.
Derivatives trading can lose you your entire margin. See the disclaimer.