 RonOnCrypto
Long short ratio explained: how to read account long/short data with OI and funding
On this page · 9
- What is the long short ratio?
- Account long short ratio vs size ratio: what is the difference?
- Example: what does a 2.0 long short ratio mean for contracts?
- How to read the long short ratio with open interest
- How to read the long short ratio with the funding rate
- Long short ratio and the Hyperliquid liquidation map
- Limits and common mistakes when reading the long short ratio
- Checklist: reading the long short ratio before a trade
- Use the tool: check the long short ratio on the dashboard
| Pair | Price | 24h | Funding (8h) | Annualized | Open interest |
|---|---|---|---|---|---|
 BTC | - | - | - | - | - |
 ETH | - | - | - | - | - |
 SOL | - | - | - | - | - |
Source: public exchange APIs (Binance, OKX fallback). Annualized = 8h funding × 3 × 365. Open the full dashboard.
The long short ratio is the number of accounts holding long positions divided by the number of accounts holding short positions on a derivative contract, such as the BTC/USDT perpetual. A ratio of 2.0 means there are 2 long accounts for every short account, so about 66.7% of accounts are long. The ratio counts traders, not money: every contract has one long side and one short side of the same size, so a 2.0 ratio still comes with exactly 1 long to 1 short in contract size.
This guide covers the definition and formula, how the account ratio differs from a size ratio, a worked example, how to read it with open interest (with 7 days of real data), with the funding rate and with the Hyperliquid liquidation map, common reading mistakes, and a checklist tied to the 1% risk rule. The short answer: the long short ratio shows which way the crowd leans by headcount, so it is only useful when compared with itself and read alongside OI and funding.
| Attribute | Value |
|---|---|
| Also called | Long short ratio, long/short account ratio, L/S ratio |
| Formula | Accounts holding longs ÷ Accounts holding shorts |
| Quick read | Above 1: more long accounts; below 1: more short accounts; 1: balanced |
| Source on the RonOnCrypto dashboard | OKX, USDT perpetuals, 1-hour data, counting accounts |
| Exists in | Dated futures and perpetual futures; not spot |
| Does not tell you | Which side holds more money, or where price will go |
What is the long short ratio?
The long short ratio is the number of accounts holding longs divided by the number of accounts holding shorts on one contract at one moment. OKX’s API v5 documentation describes this data as the “account long/short ratio of a contract”, with the returned value defined as the “long/short position num ratio of all traders”, meaning the count of traders holding longs against the count holding shorts (OKX API v5, Get contract long/short ratio, accessed 2 November 2026).
Long short ratio = Accounts holding longs ÷ Accounts holding shorts
To turn the ratio into a share of long accounts, use: % long accounts = Ratio ÷ (1 + Ratio). A few reference points:
| Long short ratio | % long accounts | % short accounts |
|---|---|---|
| 0.5 | 33.3% | 66.7% |
| 1.0 | 50.0% | 50.0% |
| 1.5 | 60.0% | 40.0% |
| 2.0 | 66.7% | 33.3% |
| 3.0 | 75.0% | 25.0% |
If you are not yet clear on how the two trade directions work, start with the guide to long vs short in crypto.
Account long short ratio vs size ratio: what is the difference?
The account ratio counts how many traders sit on each side, while a size ratio compares how many coins or dollars each side holds; across a whole contract, the long/short size ratio is always 1. The reason: every contract that opens has one long and one short of the same size, so total longs equal total shorts. That is why exchanges can only publish two kinds of meaningful ratio: an account-count ratio, or a size ratio for a subgroup (for example the largest traders).
| Account ratio | Size ratio (whole contract) | Subgroup ratio | |
|---|---|---|---|
| Counts | Accounts on each side | Size on each side | Accounts or size within that group |
| Possible values | Any positive number | Always 1 | Any positive number |
| Example | OKX: account ratio, 1-hour data | Not published, since it is always 1 | OKX: top 5% of traders by position value; liquidation map: large wallets on Hyperliquid |
| Answers | Which way does the crowd lean? | Nothing | Which way does this group lean? |
The RonOnCrypto dashboard uses OKX’s account ratio: long accounts divided by short accounts on USDT perpetuals, 1-hour data, pulled from OKX’s public trading statistics (rubik) API. OKX defines its “top traders” as the top 5% of traders by open position value (OKX API v5, Get top traders contract long/short ratio, accessed 2 November 2026), and that group’s ratio can look nothing like the all-accounts ratio. Two long/short numbers are only comparable with the same source, the same group and the same time frame.
Example: what does a 2.0 long short ratio mean for contracts?
A long short ratio of 2.0 means there are twice as many long accounts as short accounts, while long size and short size remain equal. The long side has more traders; the short side has fewer traders, each holding more size.
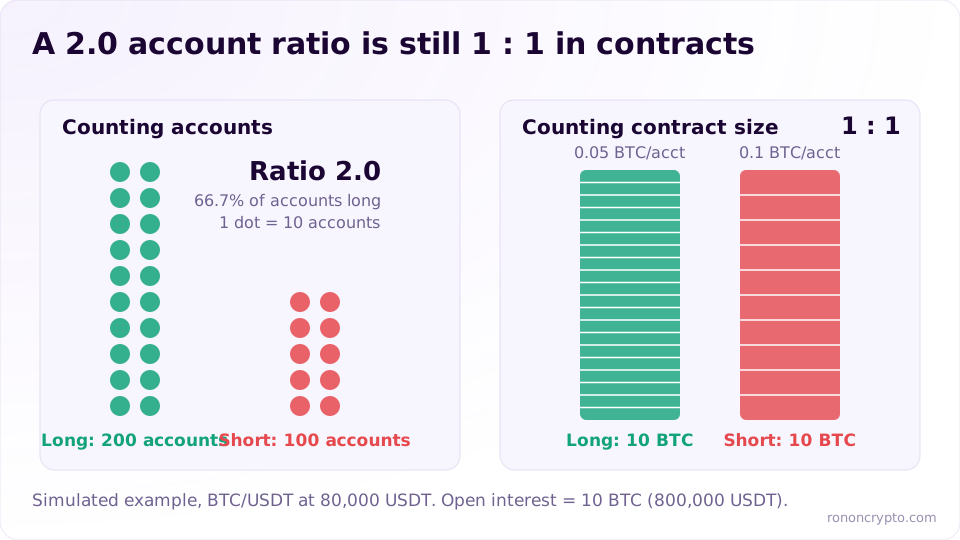
This example uses the BTC/USDT perpetual at 80,000 USDT:
- 200 accounts hold longs, 10 BTC in total, 0.05 BTC per account on average.
- 100 accounts hold shorts, 10 BTC in total, 0.1 BTC per account on average.
- Long short ratio = 200 ÷ 100 = 2.0, so 66.7% of accounts are long.
- Open interest = 10 BTC (800,000 USDT), because OI counts only one side of each contract.
In money terms the two sides are balanced 1 : 1. What is lopsided is how the money is split: the long side is spread across many small positions, the short side sits in fewer, larger ones. A 2.0 ratio does not mean “twice as much money long as short”.
The ratio jumps when small accounts pile in
The account ratio is very sensitive to small accounts, so it can rise sharply while contract size barely moves. Continuing the example of 200 long and 100 short accounts: 100 small accounts each open a 0.01 BTC long (1 BTC in total), matched by one account opening a 1 BTC short.
| Before | After | Change | |
|---|---|---|---|
| Long accounts | 200 | 300 | +100 |
| Short accounts | 100 | 101 | +1 |
| Long short ratio | 2.00 | 2.97 | +48.5% |
| % long accounts | 66.7% | 74.8% | |
| Open interest | 10 BTC | 11 BTC | +10.0% |
The ratio rose by almost half while open contracts rose by only 10%. That makes the long short ratio a headcount measure, not a money-flow measure. How open contracts are counted is explained in the guide to open interest.
How to read the long short ratio with open interest
Open interest shows whether positions are being added or closed, and the long short ratio shows which side is gaining or losing traders; read together, they show who is coming in and who is leaving. Seven days of real BTC data from the RonOnCrypto daily brief (snapshot at 07:00 Vietnam time, 27 October to 2 November 2026) show this clearly: the ratio ranged from 1.77 to 2.81 while funding sat at 0.01% per interval.
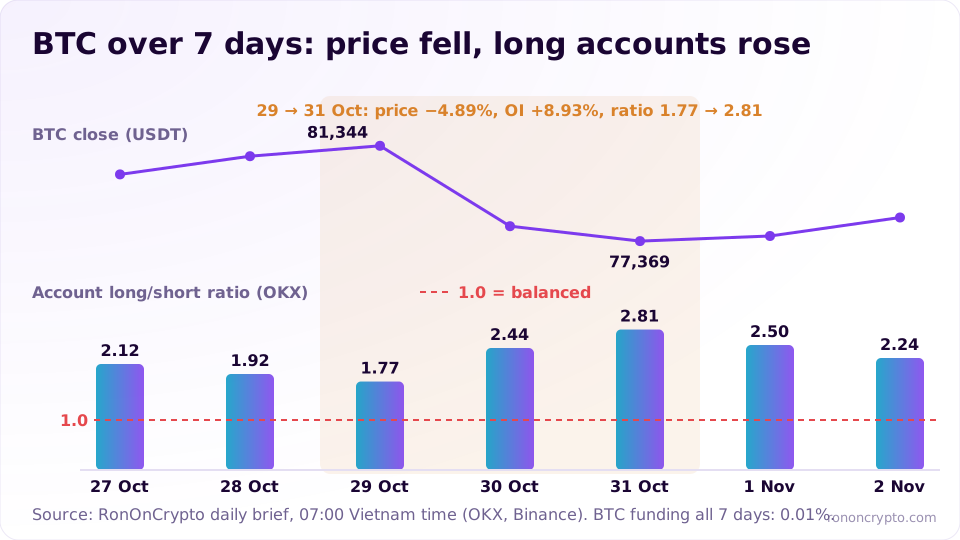
The four basic combinations of ratio direction and OI direction below are common readings, not entry signals; each combination can have more than one cause.
| Long short ratio | OI | Common reading | What to watch |
|---|---|---|---|
| Up | Up | Many new long accounts opening, matched by fewer short accounts holding more size | Leverage is building and the long side is more crowded by headcount |
| Up | Down | Short accounts closing or being liquidated, so the short headcount shrinks | Positions are leaving the market; this is not fresh money arriving |
| Down | Up | Many new short accounts opening | Leverage is building on the short side by headcount |
| Down | Down | Long accounts cutting losses, taking profit or being liquidated | The long side is thinning out and leverage is flushing |
7-day observation: BTC from 27 October to 2 November 2026
Over the last 7 briefs, the BTC account long short ratio on OKX rose from 1.77 to 2.81 just as price fell and OI rose, then eased back to 2.24 as price recovered slightly and OI fell. The data comes from the daily crypto market brief, each row taken at 07:00 Vietnam time. Closing prices come from the Binance BTC/USDT spot daily candle; OI, funding and the long/short ratio come from the OKX BTC-USDT-SWAP contract.
| Date | BTC close | 24h | Funding (8h) | Open interest | OI vs previous day | Long/short (accounts) | % long accounts |
|---|---|---|---|---|---|---|---|
| 27 Oct | 80,150.56 | 0.00% | 0.01% | $2.55B | +5.64% | 2.12 | 67.9% |
| 28 Oct | 80,909.77 | +0.95% | 0.01% | $2.51B | −1.62% | 1.92 | 65.8% |
| 29 Oct | 81,343.50 | +0.54% | 0.01% | $2.48B | −1.12% | 1.77 | 63.9% |
| 30 Oct | 77,991.89 | −4.12% | 0.01% | $2.55B | +2.77% | 2.44 | 70.9% |
| 31 Oct | 77,368.77 | −0.80% | 0.01% | $2.70B | +6.00% | 2.81 | 73.8% |
| 1 Nov | 77,582.02 | +0.28% | 0.01% | $2.68B | −0.72% | 2.50 | 71.4% |
| 2 Nov | 78,354.00 | +1.00% | 0.01% | $2.64B | −1.58% | 2.24 | 69.1% |
From 29 to 31 October, price fell 4.89%, OI in USD rose 8.93% (+14.53% in BTC terms, since falling price drags USD-denominated OI down), and the ratio rose 58.8%. That is the “ratio up, OI up” case: new positions opened, and the side opening longs gained many more accounts than the side opening shorts. A reasonable reading (an inference this data cannot confirm) is that many small accounts opened longs into the drop. From 31 October to 2 November, price rose 1.27%, OI fell 2.29% and the ratio fell 20.3%: some long accounts closed. The table does not say where price goes next; it only shows who came in and who left that week.
The four open interest and price scenarios, and how price moves USD-denominated OI, are in the guide to open interest.
How to read the long short ratio with the funding rate
The funding rate shows which side is paying to hold its positions, while the long short ratio shows which side is more crowded; when both lean the same way, both headcount and money stand behind the lean. Positive funding means longs pay shorts, usually every 8 hours. 0.01% per interval is the common baseline; on a 909.50 USDT position it costs about 0.27 USDT a day.
| Long short ratio | Funding | Common reading |
|---|---|---|
| High, rising | Positive, well above baseline | Both headcount and money lean long; the long side is crowded and paying up |
| High | Near baseline | Many long accounts, but the lean is not strong enough to push the contract above spot |
| Low, falling | Negative | Both headcount and money lean short; the short side is crowded and paying |
| Low | Positive | Few long accounts, yet longs still pay: large long positions dominate in money terms |
BTC data on OKX from 27 October to 2 November 2026 falls in the second row: the account long short ratio never dropped below 1.77, yet funding stayed at 0.01% for all 7 snapshots. The crowd leaned long by headcount, but the contract price was not pushed away from spot in that direction. It is a real example of account counts and money telling two different stories.
How to calculate the funding fee, annualized funding and the four cases for reading funding with OI are covered in crypto funding rates explained.
Another sentiment gauge, on a 0–100 scale, is the crypto Fear and Greed Index.
Long short ratio and the Hyperliquid liquidation map
The RonOnCrypto liquidation map shows whether large wallets on Hyperliquid lean long or short by size and where their liquidation prices sit, so it complements OKX’s account ratio rather than replacing it. The Hyperliquid liquidation map uses Hyperliquid’s public on-chain data, scanning the BTC and ETH positions of wallets with more than 1 million USD in account value from the public leaderboard, updated hourly. These are large wallets on one platform, not the whole market.
On the morning of 2 November 2026, the two sources painted two different pictures:
| Source | Time | Group counted | Counted by | Result |
|---|---|---|---|---|
| OKX, BTC perpetual | 07:00 Vietnam time | All accounts with a position | Account count | Ratio 2.24, so 69.1% of accounts long |
| Hyperliquid, BTC | 08:08 Vietnam time | Positions of 2,851 scanned large wallets | Size | Long 9,361.4 BTC, short 13,482.5 BTC, so 41.0% of size long |
On Hyperliquid the position count was almost even (160 long positions, 158 short positions), but short size was larger: the large-wallet long/short size ratio was 0.69. The two numbers come from different platforms, different groups of traders, different counting methods and are 68 minutes apart, so they cannot be added together or compared directly. What you can read is this: the crowd of OKX accounts leaned long on the same morning that the scanned large wallets on Hyperliquid leaned short by size.
The liquidation map also shows where the large wallets’ liquidation prices cluster. When one price zone holds many liquidation levels, price moving into it can trigger a run of forced closes. How a single liquidation level is calculated is in liquidation price explained.
How to read the liquidation walls, the largest liquidation levels and the heatmap is covered in liquidation heatmap explained.
Limits and common mistakes when reading the long short ratio
The long short ratio has 5 main limits: it counts traders not money, each exchange measures it differently, it reflects one exchange, it depends on the time frame, and there is no standard “too high” threshold.
- Traders, not money. A 1 BTC short account and a 0.01 BTC long account count the same. A 2.0 ratio is not “twice the money”.
- Different exchanges, different definitions. Some count accounts, some count top-trader size, some aggregate by coin instead of by contract. Two ratios are only comparable under the same definition.
- One exchange, not the whole market. The ratio on the RonOnCrypto dashboard is OKX’s; each exchange’s users behave differently.
- Time frame. The dashboard shows the latest 1-hour data point; the daily brief snapshots at 07:00 Vietnam time. Two numbers taken at different times can differ with nothing unusual going on.
- No standard threshold. The BTC ratio on OKX stayed above 1 for all 7 observed days, so “above 1” is not unusual by itself. Compare the ratio with its own last 7 days, not with a fixed number.
Three common reading mistakes:
- Fading the crowd mechanically. “The ratio is high, so short” ignores that the ratio can stay high for days. The ratio gives no timing, and shorting without a stop just because the crowd is long is a bet, not a reading of data.
- Confusing the ratio with buying pressure. Total longs always equal total shorts on a contract. A rising ratio does not mean more money is buying.
- Reading one number on its own. Without OI and funding, a 2.24 ratio only says “more accounts are long”, not whether those are new or old positions, big money or small.
Many traders lose more than they win in their first year because they enter trades out of fear of missing out. A crowd number like the long short ratio easily triggers that reflex, following the crowd or fading it, so it belongs with context data, not entry points. Read direction and momentum with RSI and the Baseline (WMA20) on the multi-timeframe RSI table.
Checklist: reading the long short ratio before a trade
The checklist for reading the long short ratio has 6 steps: check the definition, compare with the last 7 days, cross-check OI, cross-check funding, look at the liquidation map, then keep the 1% risk plan unchanged. The long short ratio should never change how much money you accept losing on a trade.
- Check the definition: which source, accounts or size, which time frame. On the RonOnCrypto dashboard: OKX, account count, 1-hour data.
- Compare with itself: open the daily brief and see where the ratio sits within the last 7 days.
- Cross-check OI: rising OI means new positions are opening, falling OI means positions are closing. Convert OI to coins if price has moved a lot.
- Cross-check funding: does funding lean the same way as the ratio? A high ratio with baseline funding means the crowd leans by headcount, not yet by money.
- Look at the liquidation map: which way large wallets on Hyperliquid lean by size, and how close their liquidation zones sit to the current price.
- Keep the trade plan unchanged: stop set first, size worked out from 1% risk, liquidation price checked to sit far from the stop.
Step 6 with a 1,000 USDT account, 1% risk (10 USDT), a BTC long entered at 80,000, stop at 79,200, fees of 0.05% per side, 10x isolated margin:
| Item | Value |
|---|---|
| Position size | 909.50 USDT (about 0.0114 BTC) |
| Margin at 10x | 90.95 USDT |
| Loss at the stop, fees included | 10.00 USDT |
| Estimated liquidation price (0.5% maintenance margin) | 72,400 USDT |
| Distance from stop to liquidation | 6,800 USDT |
Whether the ratio reads 1.8 or 2.8, every number in that table stays the same. The rule is that no trade may cost more than 1% of the account, with the stop and the size set before the click; crowd data helps with context, not as a reason to size up or widen a stop. Fees are part of that 10 USDT; base-tier maker and taker fees on major platforms are listed on the futures exchange fees page. How to place a stop based on price structure is in the guide to stop loss in crypto.
Use the tool: check the long short ratio on the dashboard
The crypto market data dashboard shows the account long short ratio for BTC, ETH, SOL, BNB and XRP on OKX perpetuals (1-hour data), next to price, funding, open interest and mark vs index in one table. The OI table on this page (price, funding and OI for BTC, ETH and SOL) pulls live data on every page load; the long/short column lives on the dashboard. A simple routine: note the ratio and OI at two points in time, check funding to see whether money leans the same way, open the liquidation map for the large wallets, and only then plan the trade. Before any trade, size it at 1% risk with the position size calculator and check the liquidation price with the liquidation price calculator.
Educational content only, not investment advice or a trading signal. Derivatives trading uses leverage, and you can lose your entire margin.
FAQ
Does a long short ratio above 1 mean Bitcoin will go up?
No. A ratio above 1 only says more accounts hold longs than shorts. Total long size and total short size on a contract are always equal, so the ratio does not measure buying or selling pressure and does not forecast direction.
Why is the Bitcoin long short ratio usually above 1?
In the 7 daily briefs from 27 October to 2 November 2026, the BTC account long/short ratio on OKX ranged from 1.77 to 2.81, always above 1. No public data explains why; a common explanation is that many small accounts open longs, while the short side is made up of fewer accounts that each hold more size.
What is the difference between the account ratio and the top trader ratio?
The account ratio counts every account with a position on the contract. The top trader ratio counts only a small group with the largest positions; on OKX that group is the top 5% of traders by open position value. The two ratios can sit far apart in the same hour.
Does spot trading have a long short ratio?
No. Exchange-published long/short ratios apply only to dated futures and perpetual futures, where holders can be long or short. Spot buying and selling leaves no short position to count.
Derivatives trading can lose you your entire margin. See the disclaimer.